 Skip to content
 ArangoDB vs. Neo4J
Estimated reading time: 7 minutes
Update: https://arangodb.com/2023/10/evolving-arangodbs-licensing-model-for-a-sustainable-
future/
Last October the first iteration of this blog post explained an update to ArangoDB’s 10-year-old license model. Thank you for providing feedback and suggestions. As mentioned, we will always remain committed to our community and hence today, we are happy to announce yet another update that integrates your feedback.
Your ArangoDB Team
ArangoDB as a company is firmly grounded in Open Source. The first commit was made in October 2011, and today we're very proud of having over 13,000 stargazers on GitHub. The ArangoDB community should be able to enjoy all of the benefits of using ArangoDB, and we have always offered a completely free community edition in addition to our paid enterprise offering.
With the evolving landscape of database technologies and the imperative to ensure ArangoDB remains sustainable, innovative, and competitive, we’re introducing some changes to our licensing model. These alterations will help us continue our commitment to the community, fuel further cutting-edge innovations and development, and assist businesses in obtaining the best from our platform. These alterations are based on changes in the broader database market.
Upcoming Changes
The changes to the licensing are in two primary areas:
- Distribution and Managed Services
- Commercial Use of Community Edition
Distribution and Managed Services
Effective version 3.12 of ArangoDB, the source code will replace its existing Apache 2.0 license with the BSL 1.1 for 3.12 and future versions.
BSL 1.1 is a source-available license that has three core tenets, some of which are customizable and specified by each licensor:
- BSL v.1.1 will always allow copying, modification, redistribution, non-commercial use, and commercial use in a non-production context.
- By default, BSL does not allow for production use unless the licensor provides a limited right as an “Additional Use Grant”; this piece is customizable and explained below.
- BSL provides a Change Date usually between one to four years in which the BSL license converts to a Change License that is open source, which can be GNU General Public License (GPL), GNU Affero General Public License (AGPL), or Apache, etc.
ArangoDB has defined our Additional Use Grant to allow BSL-licensed ArangoDB source code to be deployed for any purpose (e.g. production) as long as you are not (i) creating a commercial derivative work or (ii) offering or including it in a commercial product, application, or service (e.g. commercial DBaaS, SaaS, Embedded or Packaged Distribution/OEM). We have set the Change Date to four (4) years, and the Change License to Apache 2.0.
These changes will not impact the majority of those currently using the ArangoDB source code but will protect ArangoDB against larger companies from providing a competing service using our source code or monetizing ArangoDB by embedding/distributing the ArangoDB software.
As an example, If you use the ArangoDB source code and create derivative works of software based on ArangoDB and build/package the binaries yourself, you are free to use the software for commercial purposes as long as it is not a SaaS, DBaaS, or OEM distribution. You cannot use the Community Edition prepackaged binaries for any of the purposes mentioned above.
Commercial Use of Community Edition
We are also making changes to our Community Edition with the prepackaged ArangoDB binaries available for free on our website. Where before this edition was governed by the same Apache 2.0 license as the source code, it will now be governed by a new ArangoDB Community License, which limits the use of community edition for commercial purposes to a 100GB limit on dataset size in production within a single cluster and a maximum of three clusters.
Commercial use describes any activity in which you use a product or service for financial gain. This includes whenever you use software to support your customers or products, since that software is used for business purposes with the intent of increasing sales or supporting customers. This explicitly does not apply to non-profit organizations.
As an example, if you deploy software in production that uses ArangoDB as a database, the database size is under 100 GB per cluster, and it is limited to a maximum of three clusters within an organization. Even though the software is commercially used, you have no commercial obligation to ArangoDB because it falls under the allowed limits. Similarly, non-production deployments such as QA, Test, and Dev using community edition create no commercial obligations to ArangoDB.
Our Enterprise Edition will continue to be governed by the existing ArangoDB Enterprise License.
What should Community users do?
The license changes will roll out and be effective with the release of 3.12 slated for the end of Q1 2024, and there will be no immediate impact to any releases prior to 3.12. Once the license changes are fully applied, there will be a few impacts:
- If you are using Community Edition or Source Code for your managed service (DBaaS, SaaS), you will be unable to do so for future versions of ArangoDB starting with version 3.12.
- If you are using Community Edition or Source Code and distributing it to your customers along with your software, you will be unable to do so for future versions of ArangoDB starting with version 3.12.
- If you are using the Community Edition for commercial purposes for any production deployment either storing greater than 100 GB of data per cluster or having more than three clusters or both - you are required to have a commercial agreement with ArangoDB starting with version 3.12.
If any of these apply to you and you want to avoid future disruption, we encourage you to contact us so that we can work with you to find a commercially acceptable solution for your business.
How is ArangoDB easing the transition for community users with this change?
ArangoDB is willing to make concessions for community users to help them with the transition and the license change. Our joint shared goal is to both enable ArangoDB to continue commercially as the primary developer of the CE edition and still allow our CE users to have successful deployments that meet their business and commercial goals. Support from Arango and help with ongoing help with your deployments (Our Customer Success Team) allows us to maintain the quality of deployments and, ultimately, a more satisfying experience for users.
We do not intend to create hardship for the community users and are willing to discuss reasonable terms and conditions for commercial use.
ArangoDB can offer two solutions to meet your commercial use needs:
- Enterprise License: Provide a full-fledged enterprise license for your commercial use with all the enterprise features along with Enterprise SLA and Support.
- Community Transition We do not intend to create hardship for the community users and hence created a 'CE Transition Fund', which can be allocated by mutual discussion to ease the transition. This will allow us to balance the value that CE brings to an organization and the Support/Features available.
Summary
Our commitment to open-source ideals remains unshaken. Adjusting our model is essential to ensure ArangoDB’s longevity and to provide you with the cutting-edge features you expect from us. We continue to uphold our vision of an inclusive, collaborative, and innovative community. This change ensures we can keep investing in our products and you, our valued community.
Frequently Asked Questions
1. Does this affect the commercially packaged editions of your software such as Arango Enterprise Edition, and ArangoGraph Insights Platform?
No, this only affects ArangoDB source code and ArangoDB Community Edition.
2. Whom does this change primarily impact?
This has no effect on most paying customers, as they already license ArangoDB under a commercial license. This change also has no effect on users who use ArangoDB for non-commercial purposes. This change affects open-source users who are using ArangoDB for commercial purposes and/or distributing and monetizing ArangoDB with their software.
3: Why change now?
ArangoDB 3.12 is a breakthrough release that includes improved performance, resilience, and memory management. These highly appealing design changes may motivate third parties to fork ArangoDB source code in order to create their own commercial derivative works without giving back to the developer community. We feel it is in the best interest of the community and our customers to avoid that outcome.
4: In four years, after the Change Date, can I make my own commercial product from ArangoDB 3.12 source code under Apache 2.0?
Yes, if you desire.
5: Is ArangoDB still an Open Source company?
Yes. While the BSL 1.1 is not an official open source license approved by the Open Source Initiative (OSI), we still license a large amount of source code under an open source license such as our Drivers, Kube-Arango Operator, Tools/Utilities, and we continue to host ArangoDB-related open source projects. Furthermore, the BSL only restricts the use of our source code if you are trying to commercialize it. Finally, after four years, the source code automatically converts to an OSI-approved license (Apache 2.0).
6: How does the license change impact other products, specifically the kube-arango operator?
There are two versions of the kube-arango operator: the Community and the Enterprise versions. At this time there are no plans to change licensing terms for the operator. The operator will, however, automatically enforce the licensing depending upon the ArangoDB version under management (enterprise or community).
ArangoDB 3.12 – Performance for all Your Data Models
Estimated reading time: 6 minutes
We are proud to announce the GA release of ArangoDB 3.12!
Congrats to the team and community for the latest ArangoDB release 3.12! ArangoDB 3.12 is focused on greatly improving performance and observability both for the core database and our search offering. In this blog post, we will go through some of the most important changes to ArangoDB and give you an idea of how this can be utilized in your products.
(more…)Advanced Fraud Detection in Financial Services with ArangoDB and AQL
Estimated reading time: 3 minutes
Advanced Fraud Detection: ArangoDB’s AQL vs. Traditional RDBMS
In the realm of financial services, where fraud detection is both critical and complex, the choice of database and query language can impact the efficiency and effectiveness of fraud detection systems. Let’s explore how ArangoDB – a multi-model graph database – is powered by AQL (ArangoDB Query Language) to handle multiple, real-world fraud detection scenarios in a much more seamless and powerful way compared to traditional Relational Database Management Systems (RDBMS).
(more…)Update: Evolving ArangoDB’s Licensing Model for a Sustainable Future
Estimated reading time: 7 minutes
Updated 3/28/25 for accuracy.
Last October the first iteration of this blog post explained an update to ArangoDB’s 10-year-old license model. Thank you for providing feedback and suggestions. As mentioned, we will always remain committed to our community and hence today, we are happy to announce yet another update that integrates your feedback.
Your ArangoDB Team
ArangoDB as a company is firmly grounded in Open Source. The first commit was made in October 2011, and today we're very proud of having over 13,000 stargazers on GitHub. The ArangoDB community should be able to enjoy all of the benefits of using ArangoDB, and we have always offered a completely free community edition in addition to our paid enterprise offering.
With the evolving landscape of database technologies and the imperative to ensure ArangoDB remains sustainable, innovative, and competitive, we’re introducing some changes to our licensing model. These alterations will help us continue our commitment to the community, fuel further cutting-edge innovations and development, and assist businesses in obtaining the best from our platform. These alterations are based on changes in the broader database market.
Upcoming Changes
The changes to the licensing are in two primary areas:
- Distribution and Managed Services
- Commercial Use of Community Edition
Distribution and Managed Services
Effective version 3.12 of ArangoDB, the source code will replace its existing Apache 2.0 license with the BSL 1.1 for 3.12 and future versions.
BSL 1.1 is a source-available license that has three core tenets, some of which are customizable and specified by each licensor:
- BSL v.1.1 will always allow copying, modification, redistribution, non-commercial use.
- By default, BSL does not allow for production use unless the licensor provides a limited right as an “Additional Use Grant”; this piece is customizable and explained below.
- BSL provides a Change Date usually between one to four years in which the BSL license converts to a Change License that is open source, which can be GNU General Public License (GPL), GNU Affero General Public License (AGPL), or Apache, etc.
ArangoDB has defined our Additional Use Grant to allow BSL-licensed ArangoDB source code to be deployed for any purpose (e.g. production) as long as you are not (i) creating a commercial derivative work or (ii) offering or including it in a commercial product, application, or service (e.g. commercial DBaaS, SaaS, Embedded or Packaged Distribution/OEM). We have set the Change Date to four (4) years, and the Change License to Apache 2.0.
These changes will not impact the majority of those currently using the ArangoDB source code but will protect ArangoDB against larger companies from providing a competing service using our source code or monetizing ArangoDB by embedding/distributing the ArangoDB software.
As an example, If you use the ArangoDB source code and create derivative works of software based on ArangoDB and build/package the binaries yourself, you are free to use the software for commercial purposes as long as it is not a SaaS, DBaaS, or OEM distribution. You cannot use the Community Edition prepackaged binaries for any of the purposes mentioned above.
What should Community users do?
The license changes will roll out and be effective with the release of 3.12 slated for the end of Q1 2024, and there will be no immediate impact to any releases prior to 3.12. Once the license changes are fully applied, there will be a few impacts:
- If you are using Community Edition or Source Code for your managed service (DBaaS, SaaS), you will be unable to do so for future versions of ArangoDB starting with version 3.12.
- If you are using Community Edition or Source Code and distributing it to your customers along with your software, you will be unable to do so for future versions of ArangoDB starting with version 3.12.
- If you are using the Community Edition for commercial purposes you are required to have a commercial agreement with ArangoDB starting with version 3.12.
If any of these apply to you and you want to avoid future disruption, we encourage you to contact us so that we can work with you to find a commercially acceptable solution for your business.
How is ArangoDB easing the transition for community users with this change?
ArangoDB is willing to make concessions for community users to help them with the transition and the license change. Our joint shared goal is to both enable ArangoDB to continue commercially as the primary developer of the CE edition and still allow our CE users to have successful deployments that meet their business and commercial goals. Support from Arango and help with ongoing help with your deployments (Our Customer Success Team) allows us to maintain the quality of deployments and, ultimately, a more satisfying experience for users.
We do not intend to create hardship for the community users and are willing to discuss reasonable terms and conditions for commercial use.
ArangoDB can offer two solutions to meet your commercial use needs:
- Enterprise License: Provide a full-fledged enterprise license for your commercial use with all the enterprise features along with Enterprise SLA and Support.
- Community Transition We do not intend to create hardship for the community users and hence created a 'CE Transition Fund', which can be allocated by mutual discussion to ease the transition. This will allow us to balance the value that CE brings to an organization and the Support/Features available.
Summary
Adjusting our model is essential to ensure ArangoDB’s longevity and to provide you with the cutting-edge features you expect from us. We continue to uphold our vision of an inclusive, collaborative, and innovative community. This change ensures we can keep investing in our products and you, our valued community.
Frequently Asked Questions
1. Does this affect the commercially packaged editions of your software such as Arango Enterprise Edition, and ArangoGraph Insights Platform?
No, this only affects ArangoDB source code and ArangoDB Community Edition.
2. Whom does this change primarily impact?
This has no effect on most paying customers, as they already license ArangoDB under a commercial license. This change also has no effect on users who use ArangoDB for non-commercial purposes. This change affects community edition users who are using ArangoDB for commercial purposes and/or distributing and monetizing ArangoDB with their software.
3.Why change now?
ArangoDB 3.12 is a breakthrough release that includes improved performance, resilience, and memory management. These highly appealing design changes may motivate third parties to fork ArangoDB source code in order to create their own commercial derivative works without giving back to the developer community. We feel it is in the best interest of the community and our customers to avoid that outcome.
4. Is ArangoDB still an Open Source company?
Yes. While the BSL 1.1 is not an official open source license approved by the Open Source Initiative (OSI), we still license a large amount of source code under an open source license such as our Drivers, Kube-Arango Operator, Tools/Utilities, and we continue to host ArangoDB-related open source projects. Furthermore, the BSL only restricts the use of our source code if you are trying to commercialize it. Finally, after four years, the source code automatically converts to an OSI-approved license (Apache 2.0).
5. How does the license change impact other products, specifically the kube-arango operator?
There are two versions of the kube-arango operator: the Community and the Enterprise versions. At this time there are no plans to change licensing terms for the operator. The operator will, however, automatically enforce the licensing depending upon the ArangoDB version under management (enterprise or community).
The world is a graph: How Fix reimagines cloud security using a graph in ArangoDB
'Guest Blog'
Estimated reading time: 5 minutes
In 2015, John Lambers, a Corporate Vice President and Security Fellow at Microsoft wrote “Defenders think in lists. Attackers think in graphs. As long as this is true, attackers win.ˮ
The original problem in cloud security is visibility into my assets. If security engineers donʼt know what cloud services are running, they canʼt protect an environment. Unfortunately, first generation cloud security products were built with a list mindset, i.e. “rows and columnsˮ. They generate a list of assets and their configurations – but show no context of the relationships between connected cloud services, such as as a connection that would allow lateral movement between two disparate cloud assets.
Cloud security as a graph
A graph database like ArangoDB provides a powerful way to represent and analyze complex relationships in cloud security.
A graph is the easiest way to understand how one entity in my cloud interacts with another. By representing cloud assets as nodes in a graph and the relationships between them as vertices, I can now gain a better understanding of the nested connections in my cloud infrastructure.
By thinking about cloud resources in terms of ancestors and descendants, a cloud security engineer can solve problems in a way a table canʼt. The graph is an easier way to visualize the relationships between users and any of my cloud resources such as compute instances, functions, storage buckets and databases.
- Ancestors: The graph helps me understand the root of a security issue. What is the highest ancestor where an issue was introduced? Because I need to go all the way up and fix the problem at its origin.
- Descendants: The other way around is understanding descendants and blast radius. If I have an Internet-exposed compute instance, where an attacker is maybe able to get credentials off that instance, how many hops can that attacker go in? How much of my infrastructure is exposed due to this initial compromise?
In a cloud-native world, these graph traversal capabilities are fundamental for cloud security. Going forward, any operating model for cloud security should be built on a graph. With Fix, weʼre building such a modern cloud security tool, and weʼre building it with ArangoDB.
But first, a list!
Now that we covered the benefits of using a graph for cloud security, letʼs start with a list. Yes, a list – because sometimes, viewing my cloud assets in a graph might not be the most intuitive or useful thing.
For example, I may just want a list of my compute instance inventory across my AWS accounts. As a cloud security engineer, I want a baseline inventory of resources. I don’t really need a picture for that, I just want the list. And maybe I want to download it in a spreadsheet so I can slice and dice it, with metadata for each particular instance like create date, number of vCPUs and memory. A list is the best way to represent that information.
But if a list is enough, why collect data in a graph in the first place?
Because transformation from a graph to a table is trivial. The other way around, not so much. The graph lets you express things in a way that if you had the same data in a flat table, it would become intractable, with many different tables, foreign key relationships, and creating all kinds of joints all over the place. It just becomes too difficult to reason about.
The hard part is collecting data from cloud APIs and putting it into a graph form. Thatʼs much harder, takes time and is easy to get wrong. There are enough opportunities to make mistakes along the way, and create a representation thatʼs not correct or has bugs. Thatʼs why we believe transparency in how a cloud security product collects data matters. Both ArangoDB and Fix are open source. Our code shows how we collect and store data from cloud APIs in ArangoDB.
Graph-based analysis of cloud resources
The analysis layer of a graph is powerful because it can provide insights that tables cannot. One recent trend in security is that software engineers also take on security engineering tasks. They look after the security of their infrastructure, beyond infrastructure-as-code templates.
While Fix offers out-of-the-box visualizations and pre-built checks of compliance rules, weʼve also built a search syntax on top of the ArangoDB Query Language (AQL). With ArangoDB and AQL, I can store and query rich nested JSON-like document together with their vertices. Itʼs also easier to add and query metadata to the vertices – such as configuration data for a cloud resource. By building our syntax on top of AQL, weʼve made Fix human-friendly. Developers can easily run ad-hoc checks of the security posture of their infrastructure.
For example, activating flow logs in your VPCs is considered a security best practice by AWS. The search below finds all AWS VPCs where flow flogs are deactivated.
is(aws_vpc) with(empty, --> is(aws_ec2_flow_log))
Breaking it down, the search:
- first, finds all resources of the kind “aws_vpcˮ, no matter in which account or region they may run.
- then, filters for the VPCs without a direct relationship (successor) to an “aws_ec2_flow_logˮ resource.
A simple one line statement.
The same query expressed in SQL would require joining different tables with nested select statements, multiple where-clauses and case statements. It would be dozens of lines long and require an engineer to have knowledge of the table architecture and column names.
The power of a graph is that it lets you explore many-to-many relationships in a very easy way, in a way that a traditional row-based database just canʼt. By making security data from cloud resources available in a graph, software engineers with security responsibilities can gain visibility into the environment and reduce risks.
A graph provides context, context is king
The partnership between Fix and the ArangoDB team has brought our customers new security insights only made possible by the multi-dimensional relations of cloud resources stored in a graph. With ArangoDB, using graphs is no longer a complex computer science and operational challenge. For Fix, ArangoDB provides a graph database as a building block that makes it easy to store and query the relationships in your data.
Fix uses ArangoDB to analyze billions of relationships – in every cloud. With ArangoDB, weʼve been able to build a system that can ingest data at scale. One of our retail users ingests data from tens of thousands of cloud accounts in minutes, and then runs any type of analytics in a fraction of a second. The context of the graph helps security engineers to precisely answer questions and identify, prioritize and remediate risks – the “trifectaˮ of cloud security.
The precision, speed, and explainability of finding risks to your business is simply not possible without using a graph. When defenders can think in graphs, attackers lose.
Reintroducing the ArangoDB-RDF Adapter
Introducing ArangoDB’s Data Loader : Revolutionizing Your Data Migration Experience
Estimated reading time: 7 minutes
At ArangoDB, our commitment to empowering companies, developers, and data enthusiasts with cutting edge tools and resources remains unwavering. Today, we’re thrilled to unveil our latest innovation, the Data Loader, a game-changing feature designed to simplify and streamline the migration of relational databases to ArangoGraph. Let’s dive into what makes Data Loader a must-have tool for your data migration needs.
(more…)How ArangGraphML Leverages Intel’s PyG Optimizations
ArangoGraphML + Intel: Next-level Machine Learning Accelerated
ArangoDB and Intel have announced a groundbreaking partnership to enhance Graph Machine Learning (GraphML) using Intel's high-performance processors. This collaboration, part of the Intel Disruptor Program, will seek to integrate ArangoDB's graph database solutions with Intel's Xeon CPU. This synergy promises to revolutionize data analytics and pattern recognition in complex graph structures, marking a new era in database technology and GraphML advancements.
ArangoGraphML
ArangoGraphML, part of ArangoDB's suite, is an advanced graph machine learning platform designed for efficient data analysis and pattern recognition in complex graph structures, leveraging graph database technology to drive innovation in data intelligence and analytics.
Machine Learning Performance Challenge
The quest for speed in machine learning platforms is unending. By delving into Intel’s PyG optimizations, we aim to harness the power of CPU performance enhancements specifically tailored for Graph Neural Network and PyG workloads. As ArangoGraphML is leveraging PyG, any performance improvement is relevant for us and our customers. This exploration is not only about benchmarking Intel’s PyG optimizations but also about internal testing to measure their impact on our platform.
PyG benchmark
Our focus lies on gauging the performance of GraphML algorithms within our platform using torch.compile. This method allows us to assess the efficiency gains brought about by Intel’s PyG optimizations during the training and inference time, providing insights into the tangible benefits for our users.
Benchmark methodology
To ensure a robust evaluation, we conducted tests under controlled conditions:
- System Specifications: We have used an AWS EC2 instance specifically t2.2xlarge with 8 vCPUs and 32 GiB RAM.
- Dataset: We have used ogb-products dataset which is a large-scale undirected and unweighted graph, representing an Amazon product co-purchasing network. The task is to predict the category of a product in a multi-class classification setup, where the 47 top-level categories are used for target labels. This dataset highlights its relevance to real-world scenarios.
- Batch Size, Hidden Layers, and Number of Layers: We have experimented with different essential hyper-parameters in evaluating the performance of GraphML algorithms.
The outcomes
In our preliminary assessments, we observed a noteworthy increase in performance, achieving a speedup of up to 20%. The gains were evident when comparing the execution times of GraphML algorithms with and without Intel’s PyG optimizations. The results are presented graphically in the chart below and summarized in the accompanying table.
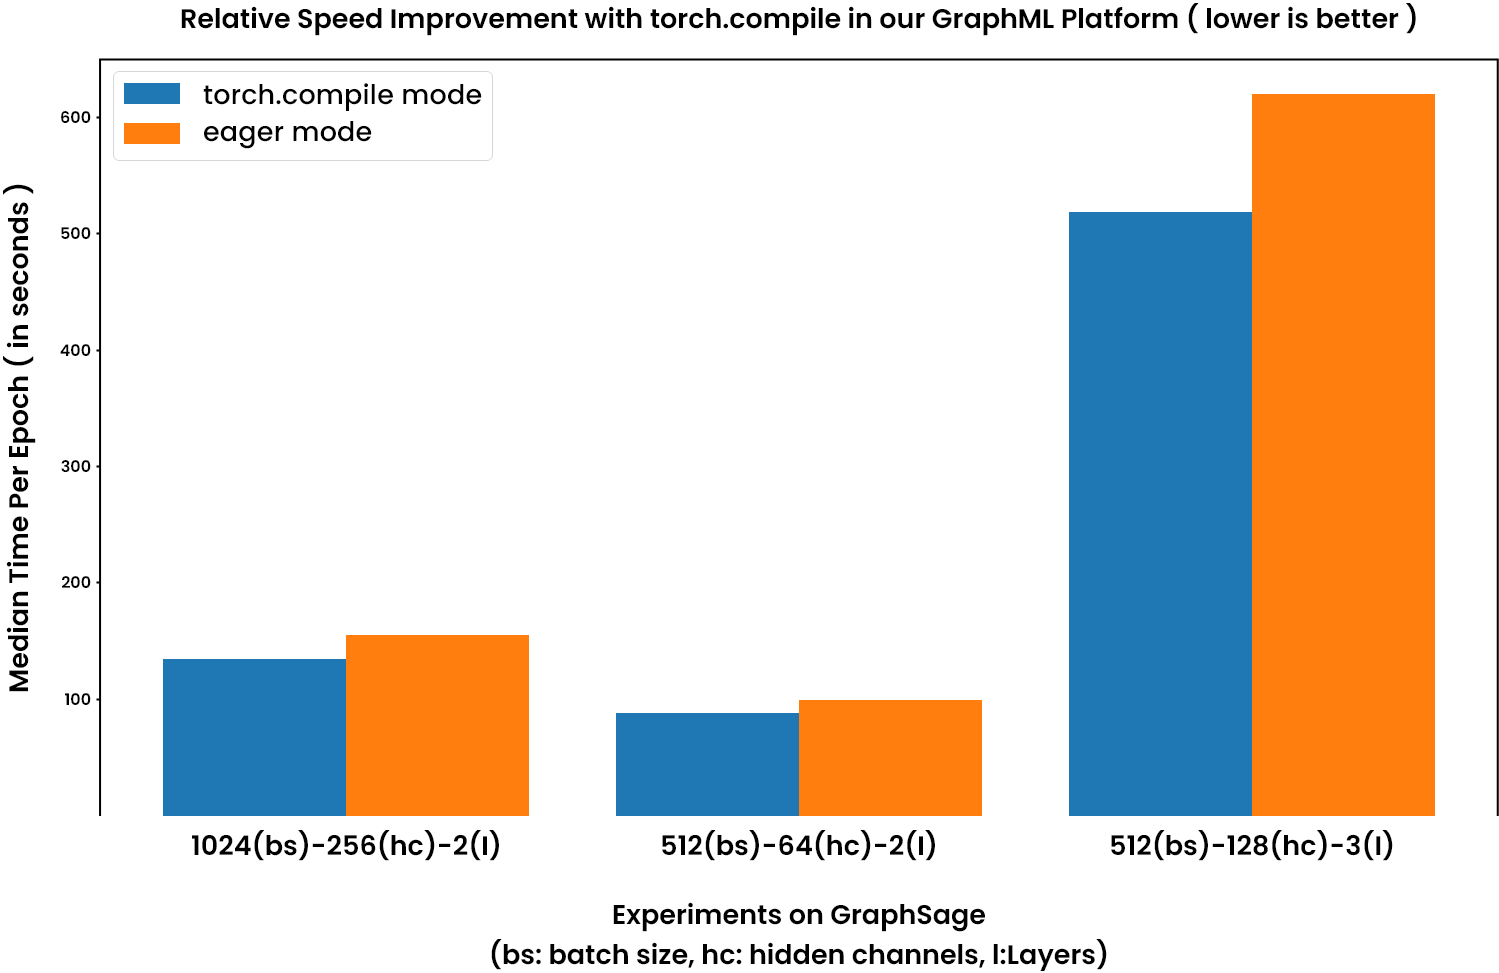
| Batch Size | Hidden Channels | Layers | Mode | Median Time per Epoch (in seconds) | Speed up |
|---|---|---|---|---|---|
| 1024 | 256 | 2 | Eager | 153.803 | |
| 1024 | 256 | 2 | Compile | 134.106 | |
| 1.15x | |||||
| 512 | 64 | 2 | Eager | 89.039 | |
| 512 | 64 | 2 | Compile | 98.714 | |
| 1.11x | |||||
| 512 | 128 | 3 | Eager | ||
| 512 | 128 | 3 | Compile | ||
| 1.12x |
Conclusion
With a demonstrated performance boost, we are now leveraging Intel’s PyG optimizations across our platform. This commitment aligns with our dedication to providing users with cutting-edge technology and optimized algorithms for their Graph Neural Network workflows.
As the field of machine learning continues to evolve, ArangoGraphML remains at the forefront, leveraging Intel’s PyTorch Geometric optimizations to ensure our users experience the fastest and most efficient ML platform available.
Stay tuned for further updates on our journey toward excellence in Graph Machine Learning!
ArangoDB’s Exciting Updates: Introducing Our Developer Hub and GenAI Bots!
Estimated reading time: 3 minutes
At ArangoDB, our commitment to empowering developers and data enthusiasts with cutting-edge tools and resources is unwavering. In line with our commitment to “Graph Done Simple,” we are thrilled to unveil two groundbreaking additions to our arsenal that promise to revolutionize your experience with our multi-model graph database.
Developer Hub: Where Knowledge Meets Accessibility
We’ve always believed in the power of community-driven knowledge sharing, and we are proud to present our brand-new Developer Hub, accessible at developer.arangodb.com. This hub is a testament to our dedication to creating an ecosystem that empowers you with the knowledge and resources you need.
(more…)Evolving ArangoDB’s Licensing Model for a Sustainable Future
Estimated reading time: 3 minutes
ArangoDB as a company is firmly grounded in Open Source. The first commit was made in October 2011, and today, we are very proud of having over 13,000 stargazers on GitHub. We believe that the ArangoDB community should be able to enjoy all of the benefits of using ArangoDB, and we have always offered a completely free community edition in addition to our paid enterprise offering.
With the evolving landscape of database technologies and the imperative need to ensure ArangoDB remains sustainable, innovative, and competitive, we’re introducing some changes to our licensing model. These alterations will help us continue our commitment to the community, fuel further development, and assist businesses in obtaining the best from our platform.
These alterations are based on changes in the broader database market.