 Skip to content
Introducing ArangoDB’s Data Loader : Revolutionizing Your Data Migration Experience
Estimated reading time: 7 minutes
At ArangoDB, our commitment to empowering companies, developers, and data enthusiasts with cutting edge tools and resources remains unwavering. Today, we’re thrilled to unveil our latest innovation, the Data Loader, a game-changing feature designed to simplify and streamline the migration of relational databases to ArangoGraph. Let’s dive into what makes Data Loader a must-have tool for your data migration needs.
Say Goodbye to Complex Relational Database Structures
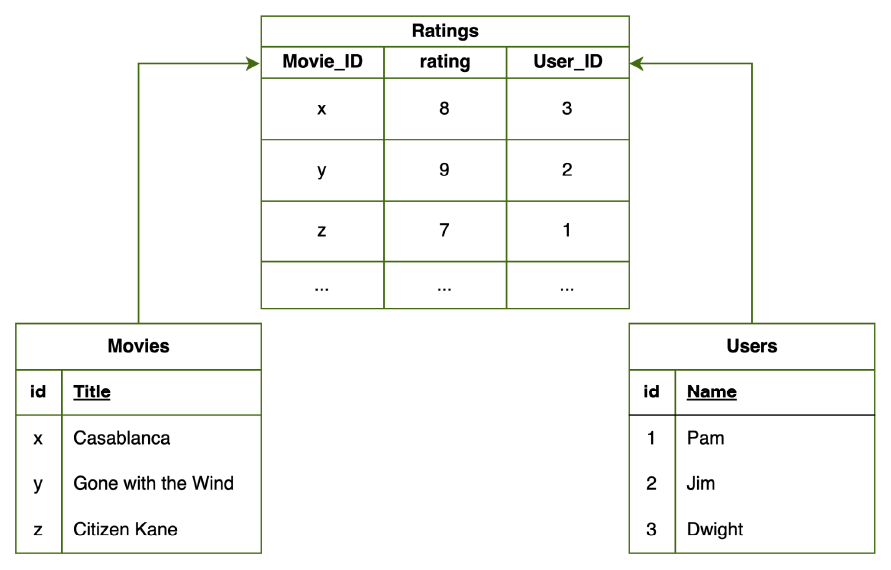
If you’ve ever grappled with the intricate relationships of old-school relational databases, where tables connect to other tables, and a third table acts as the linchpin, you understand the challenge of managing data in this convoluted setup. It’s like solving a puzzle – finding connections, managing dependencies, and ensuring data integrity, a time-consuming process prone to errors.
Data Loader is your go-to solution for effortlessly migrating relational databases to ArangoGraph. This powerful tool simplifies the process by allowing you to define edge relations between nodes with a simple drag-and-drop of raw CSV files. Whether you’re a seasoned developer or just starting your journey with ArangoDB, Data Loader provides an intuitive and user-friendly interface, making the migration process a breeze.
You could go from the old-school, less intuitive approach like this:
To a modern and intuitive approach like this:
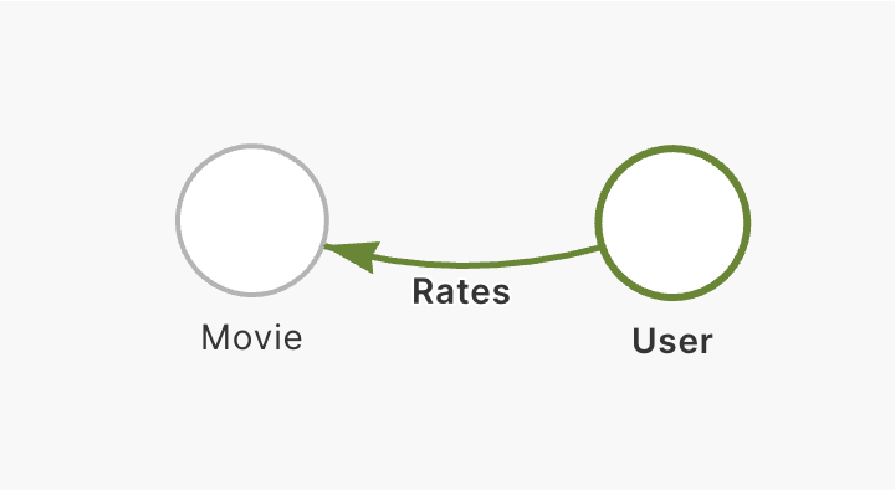
Say goodbye to the days of dealing with convoluted relational structures. Data Loader welcomes you to a new era of data management simplicity. It’s not just a tool; it’s a revolution in how you approach and manage your data relationships.
The Significance of Data Loader
The true significance of Data Loader lies in its ability to transform your existing relational tables into a graph full of relationships. By leveraging this tool, you can harness the power of ArangoGraph without the complexities of manual data migration. It’s a bridge that effortlessly connects your relational data to the world of graph databases.
Our Clear Goal: Making Data Migration Comfortable and Intuitive
Our goal with Data Loader is crystal clear – to make migrating to a graph-type model comfortable and intuitive. Whether your use case is simple or complex, Data Loader empowers you to transition from relational databases to ArangoGraph, unlocking the full potential of graph-based data modeling.
The Future of Data Loader
As we continue to evolve, Data Loader is just the beginning. We’re excited to announce that, in the future, we’ll be expanding its capabilities to support additional file formats, including TSV and JSON files. This ensures that Data Loader remains a versatile and comprehensive solution for all your data migration needs.
Get the Most Out of Your Data with ArangoDB Solutions
Get ready to supercharge your data migration experience with the power of ArangoDB solutions you already know. Whether you’re in Cyber/Threat Management, Fraud Detection, Supply Chain, or any other use case, ArangoDB offers tailored solutions to meet your specific needs.
Explore the possibilities with our Solution Accelerators, including Enterprise Knowledge Graphs, Entity Resolution, Traceability/Lineage, and Contextual Relevance. ArangoDB’s differentiators, such as Model Flexibility, Graph Scalability, Performance at Scale, and Unified Query Language, set us apart from other databases.
Start Using Data Loader Today
Use the Data Loader as much as possible and experience the power of graphs on data you’re already familiar with. With Data Loader, the transition to a graph-based model is not just efficient—it’s a game-changer for your data management strategy.
Explore the capabilities of Data Loader and witness firsthand the impact on your insights. Refer to our comprehensive Data Loader documentation to start your data migration journey. Welcome to a new era of seamless data migration with ArangoDB.
Now, let’s delve into a hands-on tutorial to guide you through the process. This tutorial leverages a sample dataset of two files: ‘airports.csv’ and ‘flights.csv.’ These files will allow us to craft a graph that showcases flights arriving and departing from diverse cities worldwide.
Let’s break down the process into easily manageable steps:
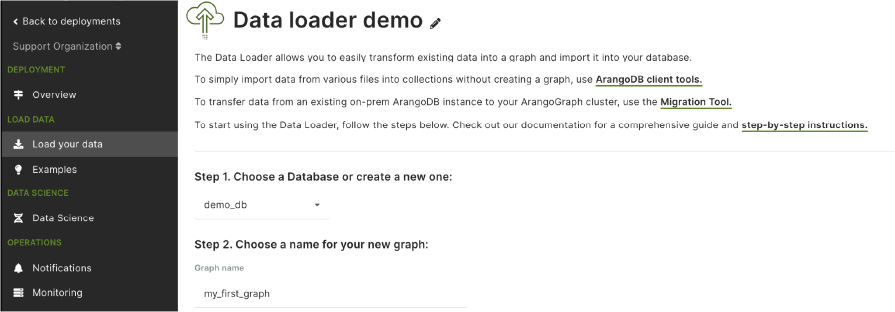
- Database and Graph Setup: Begin by naming your database and graph you would like to use for the data import.
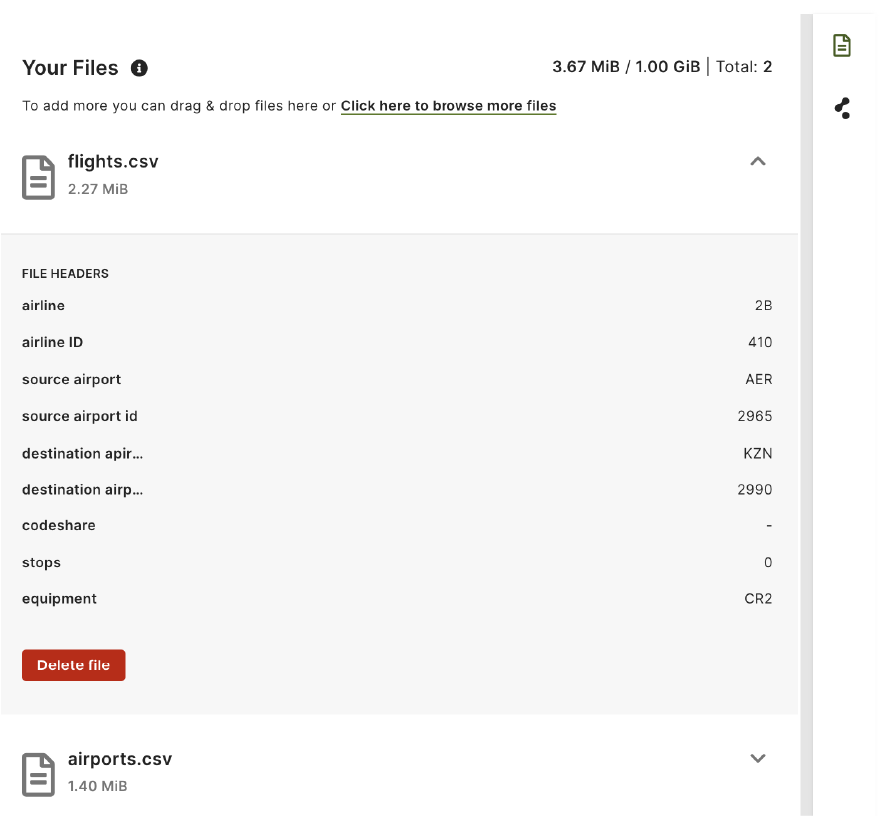
- Upload files: Use the intuitive Data Loader web interface and simply drag & drop your CSV files or upload them through the file browser window.
- Design graph: Add nodes and edges and map data from the uploaded files to them. This will allow you to create your graph’s corresponding documents and collections.
- Import data: Finally, import the data and start using your newly created graph and collections.
Eager to see it in action?
Let’s start by creating a new database and adding a name for our graph.
Now, let’s upload the files. You can drag and drop or upload them via a file browser window.
Once the files are in, we can design a graph schema. This tutorial will be a simple graph consisting of two nodes (“origin_airport” and “destination_airport”) and a directed edge going from the origin airport to the destination one representing a flight. Click Add node to create nodes and connect them with edges.
Next, for each of the nodes and edges, we create a mapping to the corresponding file and headers.
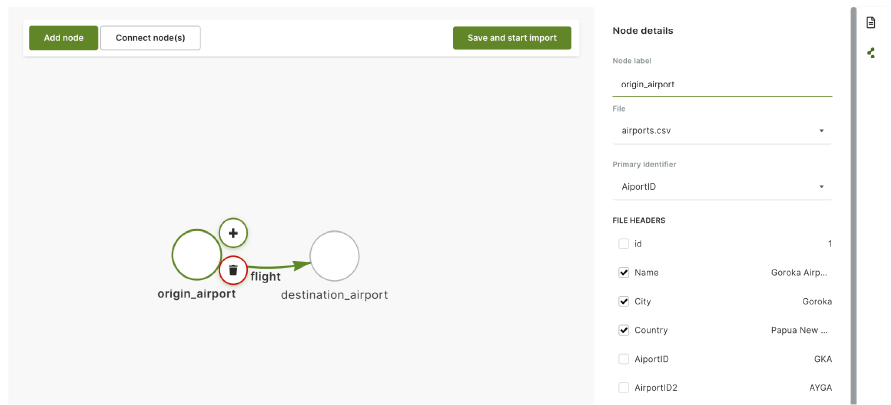
For nodes, the node label will be a node collection name, and the primary identifier will be used to populate the _key attribute of documents. We can also select any additional headers to be included as document attributes. In this example, we’re creating two node collections, “origin_airport” and “destination_airport.” The “AirportID” header will be used to create the _key attribute for documents in both node collections. The header preview makes it easy to select the headers you want to use.
For edges, the edge label is going to be an edge collection name. Then, we need to specify how edges will connect nodes. We do this by selecting the from and to nodes to give a direction to the edge. In this example, we select the “source airport” header as a source and the “destination airport” as a target for the edge.
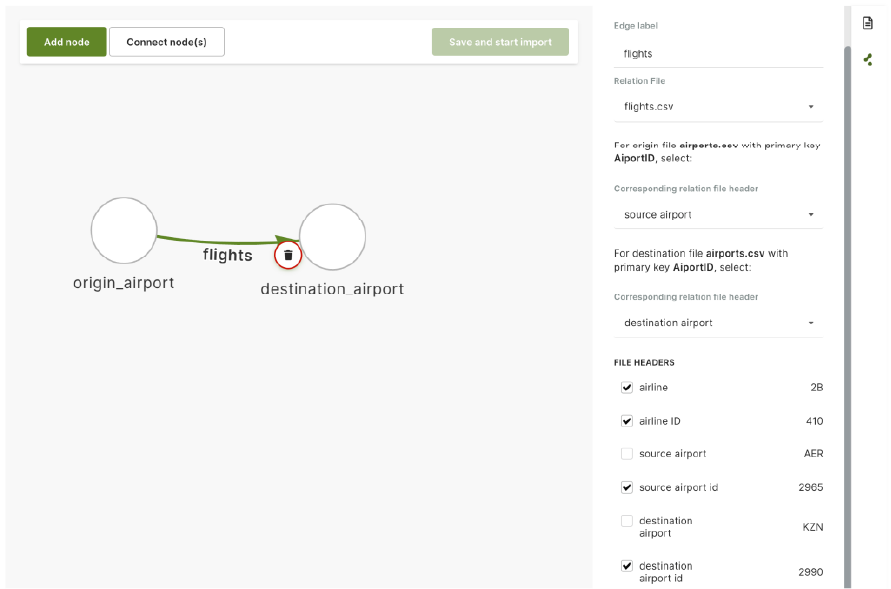
Note that the values of source and target for the edge correspond to the primary identifier (_key attribute) of the nodes. In this example, the airport code (i.e., GKA) is used as the _key in the node documents and in the source and destination headers to configure the edges.
After all the mapping is done, all we need to do is click Save and start import. The report provides an overview of the files processed and documents created and a link to your new graph.
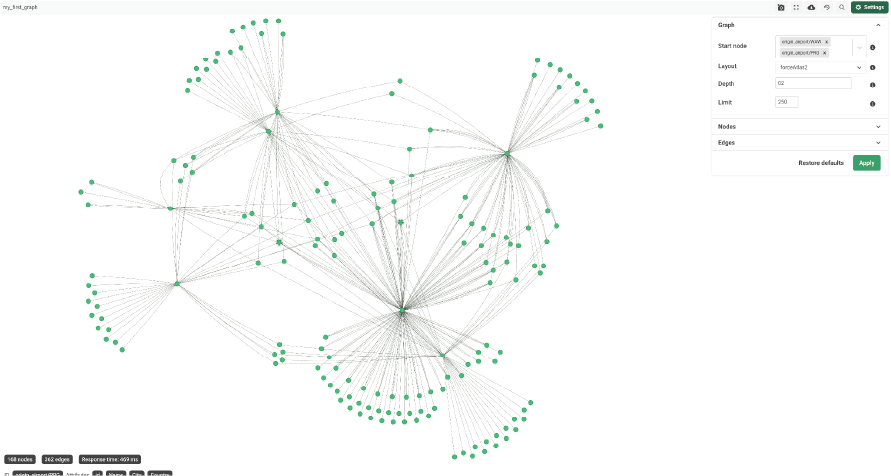
Finally, click See your new graph to open the ArangoDB web interface and explore your new collections and your new graph. Happy graphing!
Get the latest tutorials, blog posts and news: