 Skip to content
 Deploying and Securing an ArangoDB Cluster Using Docker
Introduction
Deploying a distributed database securely can be challenging, but Docker simplifies the process. This guide walks you through setting up a three-node ArangoDB cluster using Docker and Docker Compose. I'll also cover essential security measures, including authentication, TLS encryption, and automated backups.
Before You Begin
- Create a Folder: Create a dedicated folder on your system where you will store all the files related to this setup (e.g., arangodb-cluster).
- Open Terminal in the Folder: Open your terminal and navigate to the folder you just created. All commands in this guide should be run from this folder.
1. Setting Up the Cluster
1.1 Prerequisites
Before you begin, ensure that your system has the following installed:
- Docker — for containerized deployment.
- Docker Compose — for managing multi-container applications.
- OpenSSL — for generating TLS certificates.
1.2 Creating a Docker Network
Create a dedicated Docker network to ensure secure communication between cluster nodes:
Bash:
docker network create arangodb-net1.3 Create .env File
Create a .env file to store sensitive information such as the JWT secret key and the ArangoDB root password:
ARANGO_ROOT_PASSWORD=Password
ARANGO_JWT_SECRET=Z3uM7z+WkP1r8UxvOZkQ+v4R4dGFL9aA+dmby5Z1R5c=
1.4 Deploying the Cluster
Define the cluster in a docker-compose.yml file:
networks:
  default:
    name: arangodb-net
    external: true

services:
  agency1:
    image: arangodb/enterprise:3.12.4
    container_name: agency1
    command: >
      /bin/sh -c "arangod
      --server.endpoint tcp://0.0.0.0:8531
      --agency.activate true
      --agency.size 3
      --agency.supervision true
      --server.authentication true
      --agency.endpoint tcp://agency1:8531
      --agency.endpoint tcp://agency2:8531
      --agency.endpoint tcp://agency3:8531
      --agency.my-address=tcp://agency1:8531
      --server.jwt-secret $$ARANGO_JWT_SECRET"
    environment:
      - ARANGO_ROOT_PASSWORD=${ARANGO_ROOT_PASSWORD}
      - ARANGO_JWT_SECRET=${ARANGO_JWT_SECRET}
    networks:
      - default
    healthcheck:
      test: ["CMD", "sh", "-c", "arangosh --server.endpoint tcp://agency1:8531 --server.authentication true --server.username root --server.password $$ARANGO_ROOT_PASSWORD --javascript.execute 'db._query(\"RETURN 1\").toArray()'"]
      interval: 10s
      timeout: 10s
      retries: 10

  agency2:
    image: arangodb/enterprise:3.12.4
    container_name: agency2
    command: >
      /bin/sh -c "arangod
      --server.endpoint tcp://0.0.0.0:8531
      --agency.activate true
      --agency.size 3
      --agency.supervision true
      --server.authentication true
      --agency.endpoint tcp://agency1:8531
      --agency.endpoint tcp://agency2:8531
      --agency.endpoint tcp://agency3:8531
      --agency.my-address=tcp://agency2:8531
      --server.jwt-secret $$ARANGO_JWT_SECRET"
    environment:
      - ARANGO_ROOT_PASSWORD=${ARANGO_ROOT_PASSWORD}
      - ARANGO_JWT_SECRET=${ARANGO_JWT_SECRET}
    networks:
      - default

  agency3:
    image: arangodb/enterprise:3.12.4
    container_name: agency3
    command: >
      /bin/sh -c "arangod
      --server.endpoint tcp://0.0.0.0:8531
      --agency.activate true
      --agency.size 3
      --agency.supervision true
      --server.authentication true
      --agency.my-address=tcp://agency3:8531
      --agency.endpoint tcp://agency1:8531
      --agency.endpoint tcp://agency2:8531
      --agency.endpoint tcp://agency3:8531
      --server.jwt-secret $$ARANGO_JWT_SECRET"
    environment:
      - ARANGO_ROOT_PASSWORD=${ARANGO_ROOT_PASSWORD}
      - ARANGO_JWT_SECRET=${ARANGO_JWT_SECRET}
    networks:
      - default

  dbserver1:
    image: arangodb/enterprise:3.12.4
    container_name: dbserver1
    command: >
      /bin/sh -c "arangod
      --server.endpoint tcp://0.0.0.0:8530
      --cluster.my-address tcp://dbserver1:8530
      --cluster.my-role DBSERVER
      --server.authentication true
      --cluster.agency-endpoint tcp://agency1:8531
      --cluster.agency-endpoint tcp://agency2:8531
      --cluster.agency-endpoint tcp://agency3:8531
      --server.jwt-secret $$ARANGO_JWT_SECRET"
    environment:
      - ARANGO_ROOT_PASSWORD=${ARANGO_ROOT_PASSWORD}
      - ARANGO_JWT_SECRET=${ARANGO_JWT_SECRET}
    networks:
      - default

  dbserver2:
    image: arangodb/enterprise:3.12.4
    container_name: dbserver2
    command: >
      /bin/sh -c "arangod
      --server.endpoint tcp://0.0.0.0:8530
      --cluster.my-address tcp://dbserver2:8530
      --cluster.my-role DBSERVER
      --server.authentication true
      --cluster.agency-endpoint tcp://agency1:8531
      --cluster.agency-endpoint tcp://agency2:8531
      --cluster.agency-endpoint tcp://agency3:8531
      --server.jwt-secret $$ARANGO_JWT_SECRET"
    environment:
      - ARANGO_ROOT_PASSWORD=${ARANGO_ROOT_PASSWORD}
      - ARANGO_JWT_SECRET=${ARANGO_JWT_SECRET}
    networks:
      - default

  dbserver3:
    image: arangodb/enterprise:3.12.4
    container_name: dbserver3
    command: >
      /bin/sh -c "arangod
      --server.endpoint tcp://0.0.0.0:8530
      --cluster.my-address tcp://dbserver3:8530
      --cluster.my-role DBSERVER
      --server.authentication true
      --cluster.agency-endpoint tcp://agency1:8531
      --cluster.agency-endpoint tcp://agency2:8531
      --cluster.agency-endpoint tcp://agency3:8531
      --server.jwt-secret $$ARANGO_JWT_SECRET"
    environment:
      - ARANGO_ROOT_PASSWORD=${ARANGO_ROOT_PASSWORD}
      - ARANGO_JWT_SECRET=${ARANGO_JWT_SECRET}
    networks:
      - default

  coordinator1:
    image: arangodb/enterprise:3.12.4
    container_name: coordinator1
    command: >
      /bin/sh -c "arangod
      --server.endpoint tcp://0.0.0.0:8529
      --cluster.my-address tcp://coordinator1:8529
      --cluster.my-role COORDINATOR
      --server.authentication true
      --cluster.agency-endpoint tcp://agency1:8531
      --cluster.agency-endpoint tcp://agency2:8531
      --cluster.agency-endpoint tcp://agency3:8531
      --server.jwt-secret $$ARANGO_JWT_SECRET"
    environment:
      - ARANGO_ROOT_PASSWORD=${ARANGO_ROOT_PASSWORD}
      - ARANGO_JWT_SECRET=${ARANGO_JWT_SECRET}
    networks:
      - default
    ports:
      - "8541:8529"

  coordinator2:
    image: arangodb/enterprise:3.12.4
    container_name: coordinator2
    command: >
      /bin/sh -c "arangod
      --server.endpoint tcp://0.0.0.0:8529
      --cluster.my-address tcp://coordinator2:8529
      --cluster.my-role COORDINATOR
      --server.authentication true
      --cluster.agency-endpoint tcp://agency1:8531
      --cluster.agency-endpoint tcp://agency2:8531
      --cluster.agency-endpoint tcp://agency3:8531
      --server.jwt-secret $$ARANGO_JWT_SECRET"
    environment:
      - ARANGO_ROOT_PASSWORD=${ARANGO_ROOT_PASSWORD}
      - ARANGO_JWT_SECRET=${ARANGO_JWT_SECRET}
    networks:
      - default
    ports:
      - "8551:8529"

  coordinator3:
    image: arangodb/enterprise:3.12.4
    container_name: coordinator3
    command: >
      /bin/sh -c "arangod
      --server.endpoint tcp://0.0.0.0:8529
      --cluster.my-address tcp://coordinator3:8529
      --cluster.my-role COORDINATOR
      --server.authentication true
      --cluster.agency-endpoint tcp://agency1:8531
      --cluster.agency-endpoint tcp://agency2:8531
      --cluster.agency-endpoint tcp://agency3:8531
      --server.jwt-secret $$ARANGO_JWT_SECRET"
    environment:
      - ARANGO_ROOT_PASSWORD=${ARANGO_ROOT_PASSWORD}
      - ARANGO_JWT_SECRET=${ARANGO_JWT_SECRET}
    networks:
      - default
    ports:
      - "8561:8529"
Start the cluster with the following command:
bash
docker compose --env-file .env up -d
This command starts all containers in detached mode. You can access the ArangoDB web interface via the following URLs:
- Coordinator1: http://localhost:8541
- Coordinator2: http://localhost:8551
- Coordinator3: http://localhost:8561
2. Authentication and User Management
By default, ArangoDB allows root access. To enhance security, set a strong root password and create additional users with restricted privileges.
2.1 Creating a New User
Execute the following command to create a new user:
bash
docker exec -it coordinator1 arangosh --server.endpoint http+tcp://coordinator1:8529 \
--server.username root --server.password Password
To further secure access, create a dedicated database and user:
javascript
db._createDatabase("secureDB");
db._createUser("adminUser", "StrongPassword", { active: true });
3. Enabling TLS/SSL Encryption
Secure communication between nodes with TLS encryption.
3.1 Generate Certificates
Use OpenSSL to generate a private key, certificate signing request (CSR), and a self-signed certificate:
# Create private key in file "server.key"
openssl genpkey -out server.key -algorithm RSA -pkeyopt rsa_keygen_bits:2048 -aes-128-cbc# Create certificate signing request (CSR) in file "server.csr
openssl req -new -key server.key -out server.csr# Copy away original private key to "server.key.org"
cp server.key server.key.org# Remove passphrase from the private key
openssl rsa -in server.key.org -out server.key# Sign the CSR with the key, creating certificate PEM file "server.crt"
openssl x509 -req -days 365 -in server.csr -signkey server.key -out server.crt# Combine certificate and key into single PEM file "server.pem"
cat server.crt server.key > server.pem3.2 Mount Certificates in Containers
Modify the docker-compose.yml file to include the certificate and key files:
Yaml
coordinator1:
  volumes:
    - ./server.pem:/etc/arangodb3/keyfile.pem

coordinator2:
  volumes:
    - ./server.pem:/etc/arangodb3/keyfile.pem

coordinator3:
  volumes:
    - ./server.pem:/etc/arangodb3/keyfile.pem
3.3 Restart the Cluster
Apply the configuration by restarting the cluster:
bash
docker-compose restart4. Backup and Recovery
Regular backups ensure data safety and quick recovery in case of failures.
4.1 Automating Backups with arangodump
Perform manual backups with:
bash
docker exec coordinator1 arangodump --output-directory /backups --server.password Password
4.2 Scheduling Backups with cron
Automate daily backups at 2 AM:
bash
docker exec coordinator1 sh -c "echo '0 2 * * * arangodump --output-directory /backups --server.password Password' | crontab -"
4.3 Restoring from Backup
Restore data using:
bash
docker exec coordinator1 arangorestore --input-directory /backups
Conclusion
By following this guide, you have successfully deployed a secure, scalable ArangoDB cluster using Docker. This setup includes authentication, encrypted connections, and automated backups to ensure high availability and data protection. Your ArangoDB cluster is now production-ready!
Legal and Compliance challenges in modern finance and how ArangoDB plus GraphRAG solves them
Estimated reading time: 4 minutes
In today’s financial sector, staying compliant isn’t just about keeping up - it’s about keeping your organization safe, agile, and ahead of the competition. Every week new sanction headlines, revised regulations, and internal policy updates flood your compliance teams. These aren’t just bulletins; they’re pressure points. Buried inside government websites, legal PDFs, third-party data feeds, and dusty internal repositories are potential threats and obligations. And somewhere in those scattered silos, an analyst - likely under time pressure - is trying to connect the dots.
The traditional methods? Far too slow. A compliance question that should take 15 minutes might take 15 hours or even 15 days. Manual review, keyword search, endless cross-checking with policies and past decisions - this is the norm. But with the pace of change today, it’s also a serious liability.
That’s where this new combination of ArangoDB and something called GraphRAG quietly changes the game.
Imagine every policy, regulation, clause, and committee decision represented in a living graph - a database where your data is truly connected, making it easy to understand, navigate, and use. ArangoDB doesn’t just store information - it models the relationships in your data, effortlessly handling large and complex data sets. So instead of flipping through spreadsheets, documents, and inboxes, you see the structure of your compliance landscape as a whole. You see how a new AML directive links to your operations in Hong Kong, and which internal policies are suddenly out of sync. You don’t need a dozen emails. You don’t need a war room.
Here’s where it gets even more interesting. When you pair this graph with GraphRAG - combining your connected data with GenAI and Large Language Models - your compliance team can actually ask questions in plain language. “What recent regulations affect our private banking division in Asia?” doesn’t lead to a Google search. It initiates a graph search in ArangoDB. The system finds the most relevant links across your data - regulations, business units, geographies, policies - and pulls together contextual information. Then it uses a language model to respond. Not with guesswork, but with facts: citations, context, and a clear lineage from question to answer.
Unlike black-box AI tools that produce poetic but unverifiable text, the combination of ArangoDB and GraphRAG is built for audit trails. You can trace every insight back to its source. You know why the answer is what it is. And more importantly, you can show it to someone else - regulators included - and trust that it holds up.
The result? Analysts spend less time digging and more time advising. Legal teams move faster. Risk becomes something you proactively manage, not just something you react to. It’s not about removing humans from the loop. It’s about clearing the noise so they can actually do what they were trained to do.
You can feel the difference. Instead of fragmented alerts and inbox chaos, you get clarity. One connected brain that holds your institutional knowledge and links it to the wider world of regulation. It’s a leap forward, not just for compliance, but for how financial institutions think about information itself.
There’s no silver bullet in this space. But a system that combines structured knowledge, flexible querying, and natural language explanation - backed by a graph that evolves with your business - might be as close as it gets. Compliance doesn’t need to feel like a burden. With the right tools, it can become a strategic asset.
Deploying ArangoDB on Kubernetes and customizing settings
Estimated reading time: 6 minutes
Introduction
Deploying an ArangoDB cluster on Kubernetes is a straightforward process thanks to the ArangoDB Operator, a powerful tool that simplifies the deployment, management, and scaling of ArangoDB clusters in a Kubernetes environment.
In this post, we’ll walk you through the steps to quickly deploy an ArangoDB cluster on Kubernetes, covering what the main components are and how to customize settings to ensure the cluster runs optimally for your needs.
The deployment steps will be followed considering that there is already a kubernetes set up and the user executing the commands has administrator privileges.
For this demonstration we will be using:
- Arangodb 3.12.4 image
- Kubernetes Server version 1.27.16
- ArangoDB Operator 1.2.46
Executing the installation steps
An ArangoDB Cluster has three main components which are the Agents, Coordinators and DB Servers, but in a Kubernetes environment these components are created as pods along with the operator pods. Therefore, the installation steps will be based on configuring yaml files and creating pods using the "kubectl" utility, as described below:
Installing the operator
kubectl apply -f $URLPREFIX/arango-crd.yaml


To use ArangoLocalStorage resources to provision Persistent Volumes on local storage, also run:
kubectl apply -f $URLPREFIX/arango-storage.yaml
kubectl apply -f $URLPREFIX/arango-storage.yaml

Confirm that the pods were created successfully
kubectl apply -f $URLPREFIX/arango-storage.yaml
kubectl apply -f $URLPREFIX/arango-storage.yaml

Storage Configuration
Create the file storage.yaml with the content below

kubectl apply -f $URLPREFIX/arango-storage.yaml
kubectl apply -f $URLPREFIX/arango-storage.yaml

Confirm that the pods were created successfully
kubectl apply -f $URLPREFIX/arango-storage.yaml
kubectl apply -f $URLPREFIX/arango-storage.yaml

ArangoDB deployment creation
After deploying the latest ArangoDB Kubernetes operator and configuring storage resources, we will create the ArangoDB database deployment itself by creating an ArangoDeployment custom resource and deploying it into our Kubernetes.
We will create a basic yaml file cluster-deployment.yaml with the content below

kubectl apply -f $URLPREFIX/arango-storage.yaml
kubectl apply -f $URLPREFIX/arango-storage.yaml

Wait for few minutes and we will find all the components pods running (3 for each of them) when confirming that the pods were created successfully. We have a working ArangoDB cluster running on kubernetes and ready to be used.
kubectl apply -f $URLPREFIX/arango-storage.yaml
kubectl apply -f $URLPREFIX/arango-storage.yaml

Customizing settings
As we showed in the previous steps, we used a basic yaml file to create the ArangoDB database deployment, it means that most settings will be the default, this is fine and may work for multiple users, but we may need to customize some settings regarding how resources are allocated or even some database parameters to support specific needs that are particular to each environment, user or application using Arangodb.
In our “cluster-deployment.yaml” we did not specify any resource limit for any of the components (agents, coordinators, DBServers), that means for example that the coordinators could use the whole memory available on the Kubernetes machine (in our case 32GB), which is something that we don’t want. The coordinator log section below highlights the statement above, we see a message that confirms the whole machine memory is available for the coordinators utilization.

In order to limit the amount of resources available for the coordinators, we modify the Arango deployment using the command “kubectl edit” to include the lines below right after the coordinators section start in the yaml configuration.
kubectl apply -f $URLPREFIX/arango-storage.yaml
kubectl apply -f $URLPREFIX/arango-storage.yaml

Each of the coordinators pods will be terminated and then started as we can see below


After having all the coordinators restarted, we look at the coordinator log again and we can see the amount of memory available for the coordinators is now only 512MB, as we specified in the deployment yaml file. The same approach can be followed for the Agents and DBServers.

Now let’s change an ArangoDB Server option, the idea is quite similar to the resource limit change we have done previously, we will need to edit the deployment yaml using the command “kubectl edit” and include the option we want to modify under the corresponding section.
For our example, we are going to enable the experimental vector index feature , available as of 3.12.4 version, by setting “--experimental-vector-index” to true, this needs to be placed under both the coordinators and dbservers sections, by including the reserved word “args” as shown below:

After saving the changes, the coordinators and dbservers pods will restart again, then we can connect to any of the coordinators to confirm that “--experimental-vector-index” is really set to true.


There we go! The experimental vector index feature was successfully enabled, by the way, you can find more information about this feature on this blog post.
Conclusion
Deploying an ArangoDB cluster on Kubernetes is a quick and efficient process, offering significant flexibility to meet the specific requirements of multiple applications. The ability to adjust resources and fine-tune ArangoDB server options ensures that your setup can be tailored to fit various business needs, performance goals, and infrastructure capabilities. Customization is relevant for maintaining optimal performance and scalability, allowing your system to evolve in line with changing demands. Associating Kubernetes and ArangoDB, you're not only simplifying deployment, but also gaining a powerful solution that adapts seamlessly to your needs.
From Sensor Noise to Strategic Insights: How ArangoDB and GraphRAG are Reinventing IoT for Smart Manufacturing
Estimated reading time: 7 minutes
The modern manufacturing floor hums not just with machines, but with data as well. From predictive maintenance and energy monitoring to quality control and supply chain automation, IoT devices now generate terabytes of time-series and event data on a daily basis.
But here’s the reality: Most of that data goes underutilized. Why? Because traditional relational databases, and even some NoSQL systems such as MongoDB, are simply not built to connect the dots across time, entities, processes, and semantic context.
This is where ArangoDB’s native multi-model architecture combined with the emerging power of GraphRAG (Graph + Retrieval Augmented Generation) changes the game.
The Challenge: Semantic Search in a Sea of Machines
Imagine a factory that produces advanced electric vehicles. Each car part travels through dozens of IoT-connected stations, generating logs about:
- Sensor readings (vibration, temperature, torque)
- Operator interactions
- Machine health stats
- Maintenance flags
- Real-time energy consumption
The plant manager might ask:
“Which batch of motor assemblies had similar vibration anomalies to the ones we just flagged in yesterday’s failed QA?”
Answering this seems straightforward, but requires:
- Linking telemetry from disparate sensors
- Finding similar incidents, causes, and actions
- Contextualizing it with historical maintenance records and root cause analyses
Traditional SQL queries? Not even close. Vector search alone? Not enough. This is where ArangoDB + GraphRAG excels.
Why ArangoDB?
ArangoDB is a native multi-model database, meaning it supports graphs, documents, and key-value pairs natively within a single engine.
For IoT + manufacturing use cases, this enables:
- Graph modeling of machine-to-machine relationships
- Time-series enrichment using ArangoSearch
- Metadata tagging and semantic context in documents
- Efficient similarity search via vector embeddings
ArangoDB’s SmartGraphs allow manufacturing systems to shard data based on physical zones or departments, improving scale and performance for massive plants.
Enter GraphRAG: Context-Aware Retrieval for LLMs
GraphRAG—short for Graph Retrieval Augmented Generation—supercharges Large Language Models (LLMs) by allowing them to query and reason over structured knowledge graphs, not just text.
In our EV factory example, a GraphRAG system can:
- Embed sensor data + human-entered notes + prior fault reports into ArangoDB
- Use vector similarity and semantic search (via ArangoSearch) to retrieve relevant context
- Traverse machine relationships, operational history, and QA outcomes as a knowledge graph
- Feed this rich, graph-anchored context into an LLM like GPT or Claude
- Output a natural-language report that not only surfaces patterns but explains why something might be happening
ArangoDB’s GraphML integration also supports embedding vectors directly into graph nodes, streamlining GraphRAG deployments. Learn more in the Graph Analytics section.
Why It Works: ArangoDB’s Unique Graph + Vector Fusion
ArangoDB allows tight fusion of:
- Graph traversal (e.g., all machines with a spindle that failed after X hours)
- Vector search (e.g., vibration signature similarity)
- Semantic filtering (e.g., maintenance done during night shift)
And because all models are natively supported, you avoid the complexity of gluing together a document DB, a vector DB, and a graph engine. This makes ArangoDB ideal for edge deployments, especially when paired with lightweight LLMs or OpenAI API integrations.
Get Started Today
Whether you’re an OT engineer, data scientist, or IT leader in manufacturing, you can start your journey with:
Final Thoughts: From Noise to Knowledge
In the age of Industry 4.0, it’s not just about collecting more sensor data. It’s about connecting it.
ArangoDB with GraphRAG empowers manufacturers to shift from reactive firefighting to proactive foresight. By merging graph intelligence, semantic memory, and real-time reasoning, it helps answer the questions that matter—faster, smarter, and with more context than ever before.
Because in manufacturing, context is the new gold.
Integrating ArangoDB with Kubernetes for Seamless Deployment
Estimated reading time: 6 minutes
Are you a database architect or DevOps architect tasked with deploying modern databases like ArangoDB on Kubernetes? Kubernetes, with its robust orchestration capabilities, provides a solid foundation for managing containerized workloads, ensuring reliability and adaptability for database deployments.
In this post, we’ll guide you through the process of deploying ArangoDB on Kubernetes, addressing common DevOps challenges like scalability, high availability, and efficient resource utilization. By the end, you'll have a practical understanding of integrating ArangoDB with Kubernetes in a way that’s both robust and future-proof.
Why ArangoDB and Kubernetes?
ArangoDB, as a multi-model database, excels at handling diverse workloads—be it document, graph, or key-value data. When paired with Kubernetes, you gain:
- Scalability: Automatically adjust resources to meet demand.
- Resilience: Ensure high availability through self-healing capabilities.
- Simplicity: Streamline deployment and updates with Infrastructure as Code (IaC).
- Automation: Minimize manual intervention with Kubernetes' built-in orchestration.
Prerequisites
Before diving into deployment, ensure you have the following ready:
- A Kubernetes Cluster: Local (e.g., Minikube) or cloud-based (e.g., AWS EKS, GKE).
- kubectl: Installed and configured to interact with your cluster.
- Helm: Installed for managing Kubernetes charts.
Step 1: Installing the ArangoDB Kubernetes Operator
The ArangoDB Kubernetes Operator simplifies the deployment and management of ArangoDB clusters. It automates tasks like scaling, failover, and configuration management.
Add the Helm Repository
Start by adding the ArangoDB Helm repository:
bash
helm repo update
Deploy the Operator
Install the ArangoDB operator in a dedicated namespace:
bash
This deploys the operator, which manages the lifecycle of your ArangoDB cluster.
Step 2: Configuring and Deploying an ArangoDB Cluster
Create the Cluster Configuration
Write a configuration file ( e.g., arangodb-cluster.yaml ) to define your cluster. This configuration outlines the desired topology, resource allocation, and environment settings.
Yaml
kind: ArangoDeployment
metadata:
name: arango-cluster
namespace: arangodb
spec:
mode: Cluster
environment: Production
image:
repository: arangodb/arangodb
tag: latest
tls:
mode: None
authentication:
jwtSecretName: arango-cluster-jwt
agents:
count: 3
resources:
requests:
memory: 1Gi
cpu: 500m
dbservers:
count: 3
resources:
requests:
memory: 2Gi
cpu: 500m
coordinators:
count: 2
resources:
requests:
memory: 1Gi
cpu: 500m
Apply the Configuration
Deploy your cluster by applying the YAML file:
bash
Verify the deployment status:
bash
Step 3: Addressing DevOps Concerns
Scalability
Kubernetes' horizontal scaling ensures that your ArangoDB cluster can handle fluctuating workloads:
bash
High Availability
With ArangoDB's fault-tolerant architecture and Kubernetes' self-healing, you minimize downtime. For example, Kubernetes automatically restarts failed pods:
bash
Backup and Recovery
Set up a backup strategy using Kubernetes CronJobs:
yaml
kind: CronJob
metadata:
name: arango-backup
namespace: arangodb
spec:
schedule: "0 2 * * *"
jobTemplate:
spec:
template:
spec:
containers:
- name: arango-backup
image: arangodb/arangodb
command: ["arangodump"]
args:
- "--output-directory=/backups"
- "--server.database=mydb"
restartPolicy: OnFailure
Step 4: Monitoring and Maintenance
Use Kubernetes-native tools like Prometheus and Grafana to monitor your ArangoDB deployment. Enable metrics collection by annotating your pods:
yaml
annotations:
prometheus.io/scrape: "true"
prometheus.io/port: "8529"
Summary
Integrating ArangoDB with Kubernetes offers an elegant solution for managing complex database workloads. By leveraging Kubernetes' orchestration capabilities, you can ensure your database is scalable, resilient, and easy to manage. Whether you're a seasoned DevOps professional or new to container orchestration, this setup will provide a reliable foundation for your ArangoDB deployment.
Happy deploying!
ArangoDB’s GraphRAG Transforms Healthcare Data Management
Estimated reading time: 7 minutes
Healthcare Data Challenges
Healthcare organizations across the spectrum—from large hospital systems to payers to individual providers—face unprecedented IT challenges. These include siloed information systems, complex regulatory requirements, and rapidly evolving clinical research. Add fast-growing patient expectations for personalized care, and one can relate to how challenging all this is. Traditional databases or data lakes have rigid schemas and limited modeling capabilities. They often fail to address these complex needs.
ArangoDB offers a fundamentally different approach through its native multi-model architecture that combines document, graph, and key-value models in a single database. In healthcare, we have diverse data types and complex relationships between entities (patients, providers, treatments, outcomes). ArangoDB addresses the complicated requirements in healthcare organizations, combining document, graph, and key-value models.
ArangoDB's capabilities have transformed how heterogeneous healthcare data is managed. Its flagship graph database boasts flexibility, performance, and integration capabilities. Experts say that the combination of schema-free design, SmartGraphs technology, and GraphRAG empowers healthcare data stakeholders such as doctors, insurance companies, caregivers, and regulators, among others. They are able to create comprehensive patient views, make data-driven decisions, and deploy AI-enhanced solutions. This is achieved by ArangoDB's GraphRAG while maintaining compliance and reducing costs.
The healthcare industry produces heterogeneous data streams in zettabytes (1000s of Exabytes). Based on the most recent industry reports and statistics available, the healthcare industry generated approximately 2,750 exabytes (2.75 zettabytes) of data in 2024. This information must then be integrated, analyzed and sent to various stakeholders such as clinics, pharma companies, and tech vendors. ArangoDB's flexible, schema-free design enables this integration while its graph capabilities reveal valuable relationships that impact care quality and operational efficiency.
Core Technologies Addressing Healthcare Needs
ArangoDB's core technologies provide specific advantages for healthcare applications. Firstly, a native multi-model database, which combines document, graph, and key-value models in a single database. The goal is to reduce complexity and cost while improving data integration.
For example, the ArangoDB Data Science Suite includes a Graph Analytics Engine (GAE) for high-performance graph computations, enabling complex healthcare analytics at scale. GraphRAG Technology combines knowledge graphs with large language models (LLMs) to enable more accurate, contextual information retrieval and generation.
In the area of Enterprise Security Features, ArangoDB provides comprehensive authentication, authorization, encryption, auditing, and data masking capabilities essential for healthcare compliance.
Solutions for healthcare stakeholders
Payers
Health insurance companies face unique challenges in the important areas of managing claims, assessing risk, and detecting fraud. They're also looking to optimize costs while ensuring member satisfaction. These payers can now enhance efficiency and member experience using ArangoDB. How do they accomplish this?
Firstly, payers can develop comprehensive member profiles. ArangoDB's schema-free design enables payers to create 360-degree member profiles by integrating claims history, provider interactions, wellness program participation, and communication preferences without rigid schema constraints. As healthcare data requirements evolve with new regulations and capabilities, ArangoDB adapts without disruptive database redesigns.
What about fraud detection? Graph databases are particularly effective for detecting potentially fraudulent claims by revealing otherwise hidden or suspicious patterns and relationships. ArangoDB outperforms traditional databases in revealing these connections, with benchmark results showing up to 8x faster performance than competing graph databases.
One additional way in which payers can enhance efficiencies and member experiences is through network optimization and risk assessment. SmartGraphs technology enables payers to model provider networks as graphs. The provider network models are then optimized for coverage, accessibility, and performance. Payers can identify high-performing providers by analyzing referral patterns and outcomes across large populations. They could use this analysis to create more accurate risk assessments.
Providers
For providers and hospitals, they are most interested in improving care delivery and operations. Providers need solutions that improve care coordination and enhance operational efficiency. In today's healthcare businesses, supporting clinical decision-making has become a priority to improve efficiencies and cut costs. ArangoDB offers several key capabilities to providers and hospitals.
Let's consider unified patient records, which are typically found in systems such as Epic. Improved clinical decision-making and care coordination are an ongoing need. ArangoDB's multi-model approach allows providers to integrate diverse data types—electronic medical records, lab results, imaging studies, and external health information—into comprehensive patient views. This 360-degree perspective supports better clinical decision-making and care coordination.
If you want enhanced clinical decision support, this is the right solution. GraphRAG greatly enhances clinical decision support. This is achieved by providing contextually relevant information at the point of care. As demonstrated in the Decoded Health case study, this approach enabled doctors to serve four times more patients (from 2,000 to 8,000) by streamlining patient conversations and surfacing situationally appropriate information.
Graphs help optimize providers' operations. Let's discuss how. Hospitals, private practices, and clinics could leverage ArangoDB's graph capabilities. Firstly, they could model workflows as well as patient journeys. We can model even resource utilization. This modeling helps identify bottlenecks and inefficiencies, optimize staffing, and improve resource allocation. The SmartGraphs technology enables these complex analyses to run efficiently across large, distributed datasets.
Doctors and Private Practices
For doctors and private practices, streamlining workflows and enhancing care is critical. Physicians and smaller practices need solutions that enhance clinical effectiveness without adding administrative burden. ArangoDB provides several important advantages in this context.
What about streamlined workflow integration? ArangoDB simplifies the integration of practice management systems, EHRs, and external data sources. In the past, this required complex integration projects. The schema-free design accommodates diverse data formats and structures. AQL (ArangoDB Query Language) efficiently retrieves and analyzes patient information.
Physicians look for enhanced clinical insight at the point of care. ArangoDB GraphRAG technology allows physicians to search for comprehensive patient information and context-sensitive medical knowledge across systems. They don't need to learn a complex query language. Clinicians can now use queries in English or in another natural language. This user interface, compared to using a complicated query language against a rigid schema, slashes the amount of time that clinicians currently spend searching for information. Physicians can thus make faster, more informed clinical decisions.
With large practices, practice management is time-consuming and complicated. ArangoDB's versioning capabilities maintain comprehensive audit trails essential for compliance with healthcare regulations. The enterprise features ensure HIPAA compliance through authentication, authorization, encryption, and auditing capabilities.
Patients
What about patients? How can this technology help them? Modern patients demand personalized care and engagement. They seek out transparent care experiences.
By creating unified views of each patient's health data across providers and time, ArangoDB enables truly personalized care plans and recommendations. The time-based knowledge graph capability allows for understanding a patient's health journey over time.
A clinician can use a conversational interface to ask questions about patient history and the specific context of the health issue. These interfaces, when combined with GraphRAG, can translate complex medical information into understandable language and provide personalized explanations based on the patient's specific conditions.
For data transparency and privacy, you need trusted audit trails. ArangoDB's audit trails lead to data clarity and help regulators and patients. Patients can confidently access their complete health records online, knowing that their information is secure and used appropriately.
SmartGraphs: Enabling High-Performance Distributed Healthcare Analytics
SmartGraphs enables high-performance distributed healthcare Analytics. As healthcare data volumes grow to zettabytes, we need to distribute data efficiently. ArangoDB's SmartGraphs technology gives improved performance to several clients. But how exactly is this accomplished?
SmartGraphs automatically distribute healthcare data across many hardware servers based on natural relationships. This keeps related patient data co-located with each other. Why? We want to minimize any unnecessary network communication. Healthcare payers and providers scale horizontally while maintaining outstanding performance for complex queries.
For example, by reducing network hops during complex patient data queries, SmartGraphs achieve 40-120x performance gains over regular sharded graphs. This optimization enables real-time analysis of comprehensive patient information, even across large, distributed datasets.
SmartGraphs use the "smartGraphAttribute" property to optimize data distribution. In healthcare, this might be patient ID, geographic region, or care provider, ensuring that highly connected communities of data remain on the same database server. We improve query performance by 4000% - 12000% when analyzing patient journeys, care pathways, or provider networks.
Real-Time Data Enrichment with AQL
What about real-time data enrichment? Can AQL help here?
Healthcare decision-making requires up-to-date, comprehensive information. ArangoDB's query language (AQL) enables powerful data operations essential for healthcare applications.
As we've discussed earlier, AQL can query document, graph, and key-value data through a SQL-like language. This unified approach enables complex traversals across patient journeys and care networks in the graph. You can also do sophisticated analytics on healthcare data across data types.
AQL supports comprehensive data modification operations (INSERT, UPDATE, REPLACE, REMOVE, UPSERT) for real-time data assimilation and analysis. You can update patient profiles with the latest clinical findings and interactions in real-time.
Implementation Example
The Decoded Health case study on ArangoDB’s website discusses how AQL's functionality for timestamp-based queries helps a clinician view a patient's condition at any historical point. This capability allows doctors to complete patient encounters faster and better understand medical conditions and treatments over time.
Healthcare operations require comprehensive record-keeping, such as data versions and audits for both clinical and compliance purposes. ArangoDB provides robust capabilities in this area.
ArangoDB can maintain complete histories of patient data modifications, supporting point-in-time analysis of clinical information and enabling temporal queries for understanding health trends and treatment effectiveness.
The solution records all data access and modifications with user attribution, supporting HIPAA and other compliance needs. This auditing capability verifies data integrity and appropriate access, essential for healthcare compliance.
As shown in the Decoded Health case study at ArangoDB’s website, we can put together a time-based knowledge graph. Here, each node and edge would include a timestamp for creation and expiration. Healthcare providers can now "travel" to any point in time to see a patient's condition and care history. Why is this important? For understanding disease progression and treatment effectiveness, this is critical.
GraphRAG: Context-Aware Natural Language Interface for Healthcare
What is GraphRAG? It's a context-aware natural language interface. We need intuitive, intelligent interfaces for accessing complex medical information. ArangoDB's GraphRAG delivers advanced capabilities in this context.
GraphRAG combines the strengths of knowledge graphs with large language models to retrieve precisely relevant medical information based on context and relationships. This approach reduces AI hallucinations by grounding responses in verified clinical knowledge.
GraphRAG enables healthcare organizations to deploy chatbot-style interfaces that understand clinical terminology and context. These interfaces allow natural language queries against comprehensive patient and medical knowledge, providing contextually appropriate responses based on user role and information needs.
GraphRAG implements a hierarchical approach to organizing medical information. Semantic clusters and a graph structure are the approach used. This improves transparency and interpretability by enabling tracing of sources for AI-generated responses. How does this help? By making it easier for medical professionals to verify outputs.
Implementation Considerations and Challenges
While the benefits of ArangoDB in healthcare are substantial, organizations should be aware of several implementation considerations with GraphRAG.
Firstly, examine your data integration strategy. Healthcare organizations should identify priority data sources for initial integration, define entity resolution approaches for connecting records across systems, and establish data governance practices for maintaining high-quality information.
Next, consider technical challenges such as indexing, query optimization, and performance. You should consider how to index large datasets, how to optimize queries for multi-hop questions, and how to balance performance with comprehensive data analysis when you implement ArangoDB GraphRAG.
Finally, organizations should leverage ArangoDB's HIPAA-compliant features, implement appropriate authentication, authorization, and audit controls, and utilize data masking for non-production environments.
ArangoDB's multi-model capability also reduces the total cost of ownership. Multiple database technologies are no longer needed. Real-world implementations have demonstrated a 25% reduction in cloud infrastructure costs through optimized resource utilization.
Conclusion
In conclusion, ArangoDB's GraphRAG offers a comprehensive solution that addresses the specific needs of each healthcare stakeholder. Payers gain enhanced fraud detection, comprehensive member profiles, and improved risk assessment capabilities. Providers and hospitals benefit from unified patient records, enhanced clinical decision support, and operational optimization. Doctors and private practices enjoy streamlined workflows, enhanced clinical insights, and expanded service capabilities without extensive IT infrastructure. And patients receive more personalized care, enhanced engagement, better health literacy, and greater transparency.
ArangoDB's schema-free design, real-time adaptability, SmartGraphs technology, powerful query language, comprehensive versioning, and advanced natural language capabilities, in addition to ArangoDB GraphRAG, combine to create a solution uniquely suited to healthcare's complex data challenges. As the industry continues to evolve toward more personalized, data-driven, and value-based care, ArangoDB provides the foundation for innovation and excellence across the healthcare ecosystem.
References
- https://arangodb.com/arangodb-for-healthcare/
- https://arangodb.com/solutions/case-studies/decoded-health-transforming-healthcare-with-ml-models-ontologies-and-graphs/
- https://arangodb.com/performance-at-scale/
- https://arangodb.com/native-multi-model-database-advantages/
- https://arangodb.com/2024/12/benchmark-results-arangodb-vs-neo4j-arangodb-up-to-8x-faster-than-neo4j/
- https://www.linkedin.com/pulse/role-graphrag-modern-healthcare-systems-anindita-santosa-5rqxc
- https://hipaa-software.com/arangodb/
- https://arangodb.com/2019/04/building-hipaa-compliant-applications-with-arangodb/
- https://arangodb.com/enterprise-server/smartgraphs/
- https://statusneo.com/arangodb-a-graph-database/
- https://docs.arangodb.com/3.13/aql/data-queries/
- https://www.linkedin.com/pulse/implementing-knowledge-graph-rag-clinical-decision-support-bhate-occze
- https://arangodb.com/2023/05/three-ways-to-scale-your-graph/
- https://gradientflow.com/graphrag-medgraphrag/
- https://orq.ai/blog/graphrag-advanced-data-retrieval-for-enhanced-insights
- https://www.ankursnewsletter.com/p/graph-rag-vs-traditional-rag-a-comparative
- https://arangodb.com/enterprise-server/data-masking/
- https://www.doit.com/clients/arangodb/
- https://arangodb.com/solutions/solutions-customers/
The Transformative Power of ArangoDB GraphRAG in Genomics-Driven Personalized Medicine
Estimated reading time: 7 minutes
Introduction
Personalized medicine is a truly disruptive innovation in healthcare. Medical treatment can now pivot from mass-market, standardized care models to custom-made, client-centric solutions. For example, healthcare providers can now offer precision-targeted therapeutic products and services using individual genetic data and lifestyle metrics. And this shift would drive improved patient outcomes. It would also open up brand-new market segments and revenue streams for healthcare organizations. Selling commoditized therapies turns into offering customized data-driven health management.
Personalized medicine challenges existing business models for stakeholders across the healthcare ecosystem. From pharmaceutical companies to insurers and care providers, personalized medicine becomes an opportunity for competitive differentiation.
In the long term, personalized medicine has the potential to redefine the entire healthcare value chain. New touchpoints for customer engagement emerge. Providers could cultivate a more proactive approach to health management. These therapies could be based on individual genetic profiles, environmental factors, and lifestyle choices.
At the intersection of cutting-edge genomics and advanced computational methods lies an opportunity to revolutionize patient care through technologies like GraphRAG (Graph Retrieval Augmented Generation). This white paper explores how ArangoDB's GraphRAG implementation offers unique capabilities for tackling complex challenges in personalized medicine, presenting high-impact applications with detailed analyses of challenges, solutions, and potential returns on investment.
Knowledge graphs now converge with vector-based search methods. Healthcare providers can extract meaningful insights from complex, diverse, interconnected medical data. The goal is to deliver far more accurate diagnoses and efficacious treatments. Enhanced patient outcomes will emerge across a range of clinical scenarios.
The Promise and Challenges of Personalized Medicine
"The ability to sequence an entire human genome for less than the cost of a chest x-ray series has changed everything. We are entering an era where we will be able to provide truly personalized care based on an individual's genetic makeup. However, we are still in the infancy of understanding how to interpret and apply this vast amount of information."
-Dr. Francis Collins, former director of the National Institutes of Health, key figure in the Human Genome Project.
The human genome project's completion in 2003 promised a new era of medicine where treatments would be precisely calibrated to an individual's genetic makeup. Yet, two decades later, we still struggle to realize this vision fully. Why? Because biological systems are fiendishly complex, and the tools to navigate this complexity have been, until recently, woefully inadequate.
The challenge isn't a lack of data—quite the opposite. Modern healthcare systems are drowning in information: electronic health records, genome sequencing data, biomarker measurements, clinical trial results, and a constant torrent of new research findings. What's missing is the ability to connect these disparate data points in meaningful ways, to extract insights from the noise, and to present these insights in a format that supports clinical decision-making.
Traditional databases struggle with this task because they weren't designed to handle the inherently interconnected nature of biological and medical knowledge. Relational databases force complex relationships into rigid tables, while document stores lack the structure to navigate connections efficiently. Vector databases can capture semantic similarities but miss critical relationship context.
This is where graph databases—and specifically ArangoDB's GraphRAG technology—enter the picture. By combining the relationship-focused power of knowledge graphs with the semantic capabilities of vector embeddings, GraphRAG offers a powerful new approach to personalized medicine challenges. The integration of large language models (LLMs) with knowledge graphs creates a system that retrieves relevant information and generates contextually appropriate insights and recommendations.
GraphRAG: Where Vector Retrieval meets Knowledge Graphs
Let's clarify what makes GraphRAG unique before diving into specific applications. Traditional Retrieval Augmented Generation (RAG) typically relies on vector embeddings to find content that is semantically similar. While effective for many applications, this approach treats documents as isolated units, missing the rich web of relationships between entities.
By contrast, GraphRAG structures information as interconnected nodes and edges in a knowledge graph. This allows for precise traversal of relationships—critical in medical contexts where understanding how entities relate to each other is often more important than finding similar text.
When a doctor asks, "What treatments are effective for patients with this genetic variant?" they're not looking for semantically similar documents; they're asking for a specific traversal of the relationship between variants, conditions, and treatments.
ArangoDB's implementation takes this a step further by offering a multi-model database that combines the power of graph, document, and key-value structures in a single platform. This flexibility is particularly valuable in healthcare scenarios where different types of data—structured, semi-structured, and unstructured—must be integrated seamlessly.
The integration of graphs with LLMs adds another dimension. Natural language queries are translated into precise graph traversals, with the results contextualized and presented in human-readable form. Bidirectional translation—from natural language to graph queries and back—makes the system accessible to clinical users without requiring expertise in graph query languages.
Now, let's take a look at a couple of high-impact applications of GraphRAG in personalized medicine.
Application 1: Pharmacogenomics-Based Drug Selection
The Challenge
A patient's response to medications varies dramatically based on their genetic makeup. A drug that works perfectly for one patient might be ineffective or even dangerous for another due to variations in genes that encode drug-metabolizing enzymes, transporters, or target receptors. The field of pharmacogenomics addresses this variability, but implementing its insights in clinical practice remains difficult.
Let’s take Warfarin, a widely used blood thinner, as a prime example of our current data integration challenge. Proper dosing of this medication is critical, with a razor-thin margin between an ineffective dose and one that could cause dangerous bleeding.
Our current systems struggle to efficiently integrate key data:
- Standard dosing protocols
- Characteristics of individual patients
- Genetic markers that can influence drug metabolism
Specifically, variations in two genes - CYP2C9 and VKORC1 - could require dose adjustments of up to 80% from standard protocols Without a system that can automatically flag these genetic variants and calculate adjusted dosing, we're leaving our clinicians to manually juggle complex data sets, increasing both cognitive load and the risk of errors. Similar challenges exist for numerous medications across therapeutic areas.
Today, healthcare providers face several obstacles when trying to incorporate pharmacogenomic insights. As discussed earlier, the knowledge base is vast and evolves rapidly, with new gene-drug interactions published weekly. And the relevant information is scattered across databases, research papers, and clinical guidelines. Interpreting the clinical significance of specific genetic variants also requires highly specialized expertise. Finally, integrating pharmacogenomic data with other clinical factors (age, organ function, co-medications) adds much complexity for clinicians.
Possible Solutions
Several approaches exist to address these challenges:
- Standalone pharmacogenomic decision support systems: These specialized tools focus exclusively on gene-drug interactions but often lack integration with broader clinical data
- Vector-based RAG systems: These can retrieve relevant literature based on semantic similarity but struggle with the precise relationship mapping needed for pharmacogenomic recommendations
- Rule-based expert systems: These encode explicit if-then rules for pharmacogenomic guidelines but are difficult to maintain as knowledge evolves
- ArangoDB's GraphRAG-type approach: This combines structured knowledge representation with flexible retrieval and natural language generation
Why ArangoDB GraphRAG excels for drug selection based on pharmaco-genomics
ArangoDB's GraphRAG offers distinct advantages for pharmacogenomic applications. It allows for powerful capabilities that traditional systems struggle to achieve. Multi-hop reasoning becomes possible. The system is able to connect genetic variants to enzymes to drugs to alternatives in a single query. With ArangoDB's GraphRAG, you can now traverse complex relationships, a significant improvement over conventional methods.
We are also able to preserve context. In a knowledge graph, the relationships between entities, such as how exactly a drug affects a genetic variant, are explicitly represented. Therefore, with a graph, we ensure that we don't lose crucial contextual information during the reasoning process.
Using ArangoDB's GraphRAG also allows us to integrate multiple data types. We can now cohesively query across structured variant data, unstructured clinical guidelines, and semi-structured patient records. This ability to seamlessly work with diverse data formats is crucial in the rather complex landscape of healthcare data management.
Dynamic knowledge updates become possible with ArangoDB's GraphRAG.
In the rapidly evolving field of genetics, there are novel pharmacogenomic findings emerging weekly. The ArangoDB knowledge graph could be updated without the need to retrain the entire system. This flexibility ensures that the system stays current with the latest scientific discoveries, providing up-to-date insights for clinical decision-making.
Imagine a system that transforms how clinicians interact with patient data.
Instead of manually cross-referencing multiple databases and guidelines, they could simply ask a question in natural language:
"What antidepressants are recommended for this patient given their CYP2D6 gene's poor metabolizer status?"
A platform built with ArangoDB's GraphRAG would access the data, query using AQL, and integrate data from multiple sources to answer this question. This would include the patient's electronic health record, the hospital's pharmacogenomic database, up-to-date clinical guidelines, and the latest research literature. We would get a comprehensive response from the platform's advanced analytics.
This response would include a prioritized list of recommended medications, along with an underlying reason for each recommendation, that takes into consideration the patient's specific genetic profile. It would also highlight potential drug interactions based on the patient's current medications and suggest appropriate dosing adjustments.
All of this information would be presented in a clear, actionable format for the clinician. Prescription errors would go down and the efficacy of therapies could be improved dramatically. We could really streamline clinical workflows.
We see a shift from passive data storage to active clinical decision support. This potentially reduces adverse drug events and associated costs while improving patient outcomes. Moreover, this system would be scalable across various medical specialties and adaptable as new genetic insights emerge, providing long-term value for the healthcare organization.
ROI Comparison
Implementing pharmacogenomic guidance through different approaches yields varying returns:
- Vector-only RAG: Can improve information retrieval but lacks the precision for clear recommendations, resulting in a modest 20-25% improvement in appropriate prescribing.
- ArangoDB GraphRAG: By combining precise relationship traversal with natural language interaction, adoption rates rise to 40-60%, with corresponding improvements in outcomes. One healthcare system reported an annual savings of $2.2M after implementing a GraphRAG-based pharmacogenomics approach.
The GraphRAG approach provides clear, contextual guidance that physicians can trust and easily incorporate into their workflow. This offers a significant ROI advantage over Vector-only RAG.
Application 2: Disease Risk Prediction and Prevention
The Challenge
You need to integrate multiple data types to predict an individual's risk for complex diseases like Alzheimer's, diabetes, cancer, or heart disease. These include genetic risk variants, family history, environmental exposures, lifestyle factors, and biomarker measurements. Traditional risk calculators use simplified models that capture only a fraction of these interactions, while more sophisticated approaches often become "black boxes" that clinicians hesitate to trust.
The challenges are many:
- Risk factors interact in complex, non-linear ways that simple scoring systems can't capture
- Different risk factors operate on different time scales and with varying degrees of certainty
- Preventive interventions need to be tailored to the specific combination of risk factors
- Explaining risk assessments in an understandable way to clinicians is crucial for patient engagement
"We had a patient with a strong family history of breast cancer, but no identifiable BRCA1 or BRCA2 mutation. Her Tyrer-Cuzick risk score was only slightly elevated. But when we looked at her polygenic risk score, incorporating multiple moderate-risk variants, it put her at much higher risk. This case really highlighted for me how our traditional risk models might be missing important genetic contributions to cancer risk."
- Dr. Judy Garber, Director of the Center for Cancer Genetics and Prevention at Dana-Farber Cancer Institute, speaking at 2019 San Antonio Breast Cancer Symposium.
Dr. Garber's comment clearly demonstrates the limitations of conventional approaches.
Possible Solutions
We could approach the challenge in different ways:
- Statistical risk models: Frameworks like Framingham Risk Score or BOADICEA use statistical methods to combine risk factors, but they handle only a limited set of variables
- Machine learning models: These can capture complex interactions but often function as black boxes, making explanation difficult.
- Vector database approaches: These can retrieve similar cases but struggle to provide the causal reasoning needed to plan the intervention on the patient.
- ArangoDB GraphRAG-type systems: These actually represent the causal relationships between risk factors, diseases, and interventions, enabling the clinician to both predict and explain.
Why ArangoDB GraphRAG Excels
ArangoDB's GraphRAG approach is uniquely suited to disease risk prediction. For example, you would build a query in AQL that is able to navigate through various types of risk factors, such as genetic risks, lifestyle risks, environmental risks and biomarker risks.
There are several advantages to this approach with ArangoDB’s GraphRAG. Firstly, we can represent causal relationships, not just correlation.
The knowledge graph explicitly represents causal relationships between risk factors and diseases, enabling explanation rather than just predictions! Next, multi-modal integration is now possible with ArangoDB's GraphRAG approach. Genetic, environmental, and clinical data are integrated in a single model that preserves their relationships.
The clinician could plan for personalized patient interventions. The system can recommend interventions to the clinician targeted at the specific risk factors identified for an individual patient. Finally, the graph structure allows us to generate natural language explanations that trace the path from risk factors to disease risk to interventions.
ROI Comparison
Different approaches to disease risk prediction yield varying economic returns, based on implementations and studies:
- Traditional risk calculators: These improve risk stratification by 15-20% over clinical judgment alone, leading to modest improvements in preventive care utilization and an ROI of approximately 1.5:1.
- ML-based models: These can improve prediction accuracy by 25-35% but face adoption challenges due to explainability issues to clinicians, resulting in an ROI of 2:1 when successfully implemented.
- Vector-only approaches: These improve information retrieval but struggle with the causal reasoning needed for intervention planning by clinicians, limiting ROI to around 1.8:1.
- ArangoDB's GraphRAG-type approach: By combining accurate risk prediction with explainable reasoning and targeted intervention recommendations, this approach has demonstrated ROI ratios of 3:1 to 4:1 in new implementations.
The superior ROI of GraphRAG comes from its ability to identify who is at risk but also explain why they're at risk. More importantly, it goes into what specifically can be done about it. Clinicians can now implement preventive interventions tailored to individual risk profiles!
The Future of ArangoDB's GraphRAG in Personalized Medicine
The applications described in this white paper represent just the beginning of what's possible with ArangoDB's GraphRAG technology in personalized medicine. As healthcare continues to generate more data across modalities—genomics, proteomics, metabolomics, digital biomarkers, imaging, and electronic health records—the need for systems that can integrate and reason across these data types will only grow.
We see that ArangoDB's GraphRAG technology offers a powerful approach to these challenges by combining the strengths of knowledge graphs, vector embeddings, and large language models. The multi-model nature of ArangoDB's graph database and its query language AQL, is particularly well-suited to the heterogeneous data landscape of healthcare, while the integration with natural language processing makes the system accessible to clinical users without specialized technical expertise.
Looking ahead, we can anticipate several trends in the evolution of GraphRAG for personalized medicine:
- Increasingly automated knowledge graph construction: Tools that can automatically extract entities and relationships from the biomedical literature, reducing the manual curation burden
- Multimodal integration: Incorporation of imaging data, sensor readings, and other non-textual modalities into the knowledge graph
- Temporal reasoning: Enhanced capabilities for reasoning about changes over time, crucial for understanding disease progression and treatment response.
- Distributed knowledge graphs: Federation across institutions to enable larger, more comprehensive knowledge structures while preserving privacy and governance.
As these technologies mature, the vision of truly personalized medicine—tailored not just to broad population groups but to each individual's unique biological, clinical, and environmental context—comes closer to reality. GraphRAG technologies like those offered by ArangoDB represent a crucial step toward that future, offering healthcare providers powerful tools to navigate the complexity of human biology and deliver more precise, effective care.
References
- ArangoDB. (2024). GraphRAG - ArangoDB. Retrieved from https://arangodb.com/graphrag/
- Yu, PhD MD. (2024, September 14). How GraphRAG Can Enhance Healthcare: Improving Medical... LinkedIn. Retrieved from https://www.linkedin.com/pulse/how-graphrag-can-enhance-healthcare-improving-medical-yu-phd-md--fk7ae
- E2E Networks. (2025, February 27). Healthcare Knowledge Graph RAG with Neo4j - E2E Networks. Retrieved from https://www.e2enetworks.com/blog/building-a-healthcare-knowledge-graph-rag-with-neo4j-langchain-and-llama-3
- ArangoDB Documentation. (2013, November 3). Example graphs | ArangoDB Documentation. Retrieved from https://docs.arangodb.com/3.11/graphs/example-graphs/
- Gradient Flow. (2024, August 15). GraphRAG Meets Finance: Enhancing Unstructured Data Analysis... Retrieved from https://gradientflow.com/graphrag-nvidia-blackrock/
- Santosa, A. (2024, August 20). The Role of GraphRAG in Modern Healthcare Systems. LinkedIn. Retrieved from https://www.linkedin.com/pulse/role-graphrag-modern-healthcare-systems-anindita-santosa-5rqxc
- YouTube. (2024, September 23). ArangoDB GraphRAG Technical Demo - YouTube. Retrieved from https://www.youtube.com/watch?v=2Izn5g22m_0
- ArangoDB. (2024, December 2). Data Science Suite Page - ArangoDB. Retrieved from https://arangodb.com/data-science-suite-page/
- Lu, S., & Cosgun, E. (2024, November 15). Boosting GPT Models for Genomics Analysis: Generating Trusted Genetic Variant Annotations and Interpretations through RAG and fine-tuning. bioRxiv. Retrieved from https://www.biorxiv.org/content/10.1101/2024.11.12.623275v1.full.pdf
- ArangoDB. (2024, November 26). Jupyter Notebooks - ArangoDB. Retrieved from https://arangodb.com/jupyter-notebooks/
- Data Graphs. (2025, January 1). Unlock Smarter Insights with GraphRAG AI - Data Graphs. Retrieved from https://datagraphs.com/use-cases/graphrag-ai
- ArangoDB. (2024, August 5). Decoded Health | Transforming Healthcare with ArangoDB. Retrieved from https://arangodb.com/solutions/case-studies/decoded-health-transforming-healthcare-with-ml-models-ontologies-and-graphs/
- Prism14. (2024, September 26). Top 3 Applications of GraphRAG Systems Across Different Fields. Retrieved from https://prism14.com/top-3-applications-of-graphrag-systems-across-different-fields/
Benchmark Results – ArangoDB vs. Neo4j : ArangoDB up to 8x faster than Neo4j
Introduction
This document presents the benchmark results comparing the ArangoDB’s Graph Analytics Engine (GAE) against Neo4j. The GAE is just one component of ArangoDB’s Data Science Suite.
This reproducible benchmark aims to provide a neutral and thorough comparison between the two databases, ensuring a fair and unbiased assessment.
We use the wiki-Talk dataset, a widely used, real-world graph dataset derived from the edit and discussion history of Wikipedia.
The wiki-Talk dataset encapsulates communication patterns between Wikipedia users, specifically interactions on user talk pages. This dataset is used frequently in benchmarking graph databases and graph analytics systems because of its unique characteristics. The key characteristics of wiki-Talk that make it a highly reliable benchmarking dataset are: Directed Graph, Nodes and Edges, Scale, Temporal Dimension, Sparsity, etc.
The results demonstrate the efficiency and scalability of each database, and offer a representative benchmark model for organizations evaluating graph databases for their needs.
Benchmark Highlights
The benchmark results reveal several notable insights, particularly highlighting ArangoDB's superior performance in graph analytics tasks compared to Neo4j. Most strikingly:
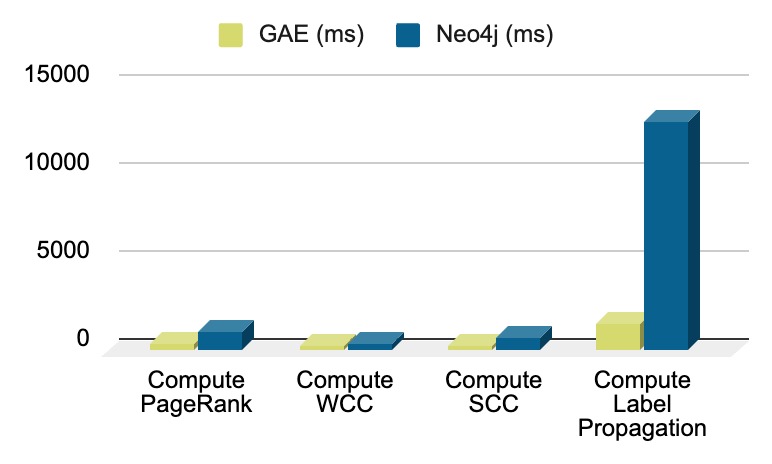
- ArangoDB consistently outperformed Neo4j across various graph computation algorithms, with performance improvements that range from 1.3 times to over 8 times faster.
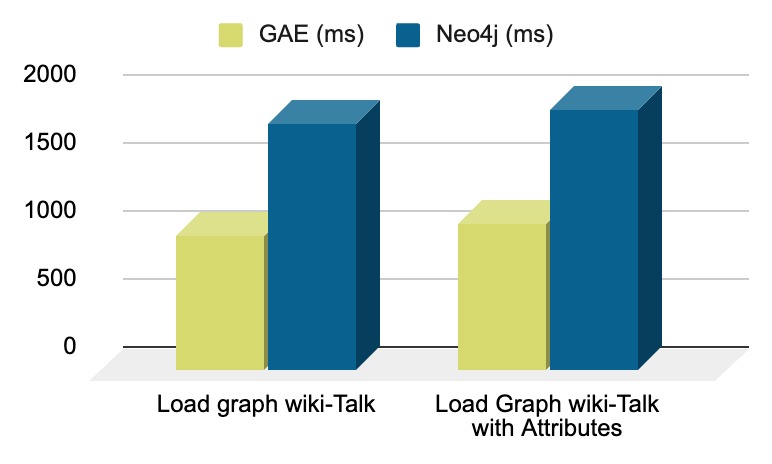
- This substantial speed advantage is also evident in graph loading times, where ArangoDB demonstrated an impressive 100% advantage in graph loading efficiency vs Neo4j, for the wiki-Talk dataset.
ArangoDB's optimized data storage and retrieval, combined with its advanced query execution and effective use of clustered deployments, also contributed significantly to its superior performance in these scenarios.
These findings underscore:
- ArangoDB's capability to handle much larger-scale and far faster real-time graph analytics applications.
- ArangoDB as a much more compelling choice for industries and organizations that require rapid data processing and analysis, such as real-time recommendation systems, social network analysis, fraud detection, and cyber security.
Benchmark Overview
Datasets (wiki-Talk)
We utilized the wiki-Talk dataset, a well-regarded dataset for evaluating graph database performance. The chosen graphs and their details are as follows:
| Graphs Used | Vertices | Edges |
|---|---|---|
| wiki-Talk | 2,394,385 | 5,021,410 |
Hardware
All tests were conducted on the same machine with the following specifications:
OS Ubuntu 23.10 (64-bit)
Memory 192 GB (4800 MHz)
CPU Ryzen 9 7950X3D (16 Cores, 32 Threads)
Database Configuration
***Neo4j***
Version 5.19.0 (Community Edition)
Deployment On-Premise, Single Process
***ArangoDB***
Version 3.12.0-NIGHTLY.20240305 (Community Edition)
Deployment On-Premise, Single Process
Graph Analytics Engine (GAE)
Version Latest
Deployment On-Premise, Single Process (RUST-based, no multithreading)
Benchmark Configuration
Two workflows were used to measure performance:
Workflow A:
- Create the in-memory representation
- Execute each algorithm once
- Measure the whole process
Workflow B
- Create the in-memory representation
- Measure graph creation time
- Execute each algorithm individually
- Measure computation time
Algorithms Tested
- Pagerank
- Weakly Connected Components (WCC)
- Strongly Connected Components (SCC)
- Label Propagation
Used Technologies
- JavaScript Framework: Vitest with tinybench
- Communication
- Neo4j: Official Neo4j JS driver ("neo4j-driver": "^5.18.0")
- GAE: Plain HTTPs requests using Axios ("axios": "^1.6.8")
Benchmark Results
Graph Loading (wiki-Talk)
| Task | GAE (sec) | Neo4j (sec) | Times Faster |
|---|---|---|---|
| Load graph wiki-Talk | 9.9 | 18 | 1.8 x |
| Load Graph wiki-Talk with Attributes | 10.7 | 19.2 | 1.8 x |
Graph Computation (wiki-Talk)
| Task | GAE (sec) | Neo4j (sec) | Times Faster |
|---|---|---|---|
| Compute PageRank | 3.8 | 10.6 | 2.8 x |
| Compute WCC | 2.3 | 4.5 | 1.7 x |
| Compute SCC | 3.2 | 6.7 | 2.1 x |
| Compute Label Propagation | 1.5 | 13 | 8.5 x |
Explanation of Elements
Graph Algorithms
- Pagerank, An algorithm that is used to rank nodes in a graph based on their connections, also commonly used in search engines.
- Weakly Connected Components (WCC), which identifies subsets of a graph where any two vertices are connected by paths, ignoring the direction of edges.
- Strongly Connected Components (SCC), Identifying subsets of a graph where every vertex is reachable from every other vertex within the same subset.
- Label Propagation, a semi-supervised learning algorithm for community detection in graphs, where nodes propagate their labels to their neighbors iteratively.
Reasons for ArangoDB’s Superior Performance
Several factors contribute to ArangoDB's superior performance:
The performance of ArangoDB on the Wiki-Talk dataset is attributed to specific architectural optimizations rather than on raw computational benchmarks. In this scenario, ArangoDB serves as a data storage system, while the computation is handled by the Graph Analytics Engine (GAE). The benchmark focuses on two key stages:
- Loading the data into the GAE
- Computation of algorithms within the GAE
Graph Loading Times
ArangoDB Side
ArangoDB’s graph loading times are optimized due to two primary factors:
- Parallel Data ExtractionArangoDB’s support for parallel data loading from both single and distributed systems is a big reason for data loading performance advantages. This capability lets teams scale to multiple machines, where increased parallelism gets you faster data transfer. By enabling efficient horizontal scaling, the system achieves significant performance improvements compared to approaches that are limited to sequential or that don’t leverage parallel extractions.
- Projections for Targeted Data TransferProjections allow ArangoDB to transmit only the data attributes required for analysis. So, if only edge IDs and a single attribute are needed, the system only extracts and transfers these fields, avoiding the overhead of transmitting entire documents. This reduces both the data volume and network latency during graph loading operations.
Graph Analytics Engine (GAE) Side
The GAE is built using RUST, and it processes the transferred data with high efficiency:
- Efficient Data Representation
The GAE stores graph data within highly optimized in-memory structures, reducing memory usage while at the same time maintaining extremely fast access speeds. Graphs are immediately ready for computation without unnecessary delays.
Advantages in the Workflow
These features deliver several tangible benefits, as shown during the benchmark:
- Fast and Parallel Data Extraction - Parallelism improves speed and scalability.
- Optimized Data Transfer with Projections - Only the required data is transmitted, minimizing overhead.
- Compact and Efficient In-Memory Representation in GA - High-performance graph computation with minimal memory footprint.
Clarifying the Benchmark Scope
It is important to note that the benchmark does not evaluate data insertion times into ArangoDB or computational tasks performed by ArangoDB itself. Instead, it assesses the efficiency of:
- Loading graph data from ArangoDB into the GAE.
- The GAE's ability to compute graph algorithms.
By highlighting these stages, the benchmark shows the advantages of ArangoDB’s design in supporting large-scale graph workflows through fast data loading and efficient interaction with the GAE.
Reproducibility of the Benchmark
This benchmark is 100% reproducible, ensuring consistent and verifiable results. These results reflect ArangoDB’s implementation per the precise specifications and configurations mentioned above. We welcome organizations to replicate the benchmark to ensure consistent results. To do this, follow these steps:
- First, set up the hardware environment with an Ubuntu 23.10 operating system, 192 GB of memory, and a Ryzen 9 7950X3D CPU.
- Install and configure the latest versions of Neo4j and ArangoDB using the provided Docker configurations. Use single-threaded (non-clustered) configurations for both.
- Next, utilize the wiki-Talk dataset for testing. Execute the specified graph algorithms (PageRank, WCC, SCC, Label Propagation) using the detailed workflows (A and B) outlined in the benchmark configuration above.
- Measure the in-memory graph creation and computation times, and compare the results for both databases. This method ensures that the benchmark can be reliably reproduced in different environments.
PLEASE NOTE: This benchmark requires the installation of the ArangoDB Graph Analytics Engine (GAE). As this code is not open source, please reach out to Corey Sommers at corey.sommers@arangodb.com to receive access to the GAE for the purposes of reproducing this benchmark in your environment (to ensure objectivity of results).
Conclusion
The benchmark results clearly demonstrate ArangoDB's far superior performance over Neo4j in the categories of graph computation and loading tasks. ArangoDB's significant speed advantages - particularly its ability to execute complex algorithms and load large datasets much faster - highlight its optimized architecture and efficient data handling.
These findings make ArangoDB a compelling choice for applications requiring high-performance graph analytics and real-time data processing.
Vector Search in ArangoDB: Practical Insights and Hands-On Examples
Vector search is gaining traction as a go-to tool for handling large, unstructured datasets like text, images, and audio. It works by comparing vector embeddings, numerical representations generated by machine learning models, to find items with similar properties. With the integration of Facebook’s FAISS library, ArangoDB brings scalable, high-performance vector search directly into its core, accessible via AQL (ArangoDB Query Language). Vector Search is now just another, fully-integrated data type/model in ArangoDB’s multi-model approach.
This guide will walk you through setting up vector search, combining it with graph traversal for advanced use cases, and using tools like LangChain to power natural language queries that integrate Vector Search and GraphRAG.
What is Vector Search and Why Does it Matter?
Vector search lets you find similar items in a dataset by comparing their embeddings. Embeddings are essentially compact numerical representations of data—like a fingerprint for each data point—that capture its essence in a way that machine learning models can process.
For instance:
- Text: An embedding might represent the meaning of a sentence.
- Images: An embedding might capture the general appearance of an object.
- Audio: An embedding might represent the rhythm or tone of a sound.
Traditional search methods like keyword matching or exact lookups can’t handle the subtle relationships captured by embeddings. Vector search fills that gap, finding semantically similar results even if the original data is complex or unstructured.
Setting Up Vector Search in ArangoDB
To get started, you need to create a vector index, which makes searching embeddings fast and efficient.
Step 1: Create a Vector Index in AQL
Imagine you have a collection called items where each document includes a vector embedding stored in the attribute vector_data. To set up an index using arangosh:
{
name: “vector_cosine”
type: “vector”
fields: [“vector_data”]
params: { metric: “cosine”, dimension: 128, nLists: 100 }
}
Explanation:
- type: "vector" specifies this is a vector index.
- dimension: 128 indicates the size of the embeddings
- metric: "cosine" defines the similarity measurement (another can be l2).
- nLists: 100 defines the number of clusters used in the index
This step prepares the collection for efficient similarity searches.
Step 2: Perform a Vector Search
Now, let’s query the items collection to find the five most similar embeddings to a query vector
[0.1, 0.3, 0.5, ...]:
LET query = [0.1, 0.3, 0.5, ...]
FOR doc IN items
LET score = APPROX_NEAR_COSINE(doc.vector_data, query)
SORT score DESC
LIMIT 5
RETURN {doc, score}
Explanation:
- SCORE: The cosine distance between the query vector and the document’s as a number between 0 and 1. The closer the score is to 1, the closer the query vector is to the document.
- APPROX_NEAR_COSINE: Compares the vector_data attribute of each document with the query vector using Approximate Nearest Neighbor search via Cosine distance.
- SORT: Orders the results by similarity score, descending.
- LIMIT: Restricts the results to the top 5 matches.
Combining Vector Search with Graph Traversals
One of ArangoDB’s strengths is its multi-model capability, which allows you to combine vector search with graph traversal. For example, in a fraud detection scenario, you might:
- Use vector search to find similar case descriptions.
- Traverse the graph to uncover related entities (e.g., linked transactions or individuals).
Example: Vector Search + Graph Traversal
LET query = [0.1, 0.3, 0.5, ...]
FOR doc IN items
LET score = APPROX_NEAR_COSINE(doc.vector_data, query)
SORT score DESC
LIMIT 5
LET related_nodes = (
FOR v, e, p IN 1..2 ANY doc GRAPH 'fraud_graph'
RETURN v
)
RETURN {doc, score, related_nodes}
Explanation:
- The first query finds documents similar to the query vector (just like the example above).
- The LET sub-query performs a graph traversal on the results, fetching nodes related to each document.
- The final RETURN combines the document, similarity score, and its related graph data.
GraphRAG: Combining Vector Search and Knowledge Graphs
GraphRAG (Graph-based Retrieval-Augmented Generation) combines vector search with knowledge graphs to enhance natural language query handling. It retrieves both semantically similar results (using vector embeddings) and highly structured insights (via graph traversal), making it ideal for use cases like law enforcement, fraud detection, and advanced recommendation systems.
How to Implement GraphRAG with ArangoDB
- Store Embeddings and Relationships
- Store vector embeddings in Document Collections (either Vertices or Edges).
- Organize Entities and their Relationships in the Graph.
- Set Up Query Pipeline
- Use Vector Search to find semantically similar items.
- Traverse the Graph to uncover related Entities and Relationships.
- Combine with an LLM (Large Language Model)
- Use the results to provide context for an LLM, enabling more accurate and context-aware responses.
Natural Language Querying with LangChain
To allow users to query using natural language, you can integrate LangChain with ArangoDB. LangChain converts a user’s natural language input into structured AQL queries. Here’s how you might implement this:
Step 1: Define the Workflow
- User inputs a query like: "Find cases similar to Cybercrime A1425 and show related transactions."
- LangChain processes the query to understand its intent and structure.
- The tool generates an AQL query combining vector search and graph traversal.
Step 2: Example LangChain Integration
from arango import ArangoClient
from langchain_openai import ChatOpenAI
from langchain_community.graphs import ArangoGraph
from langchain_community.chains.graph_qa.arangodb import ArangoGraphQAChain
# Initialize ArangoDB connection
client = ArangoClient("http://localhost:8529")
db = client.db(username=”root”, password=”test”)
# Select the LLM of choice
llm = ChatOpenAI(temperature=0, model_name="gpt-4")
# Define the natural language interface chain
chain = ArangoGraphQAChain.from_llm(
llm=llm, graph=ArangoGraph(self.db)
)
# Invoke the chain interface
response = chain.invoke(“find cases similar to Cybercrime A1425 & their related transactions”)
print(response)
Explanation:
- LangChain generates the AQL query based on the user’s input.
- The generated query could combine vector search and graph traversal, as shown earlier.
- The result is sent back to the user as structured insights.
Why Combine Vector Search with Graph?
By pairing vector search with graph traversal, you get the best of both worlds:
- Vector Search: Excels at retrieving semantically similar, unstructured data.
- Graph Traversal: Shines when exploring structured relationships.
For instance:
- In fraud detection, vector search finds similar cases, while graph traversal uncovers linked transactions and actors.
- In law enforcement, vector search identifies relevant documents, and graph traversal maps connections between suspects.
HybridGraphRAG: Combining Vector Search with Graph Traversals and Full-Text Search
HybridGraphRAG extends the power of ArangoDB by combining three advanced retrieval mechanisms: vector search, graph traversal, and full-text search. This hybrid approach ensures you can handle complex, multi-dimensional queries that involve both semantic similarity and structured data relationships.
Why Use HybridGraphRAG?
When combining these technologies, you can:
- Retrieve semantically similar documents using vector search.
- Explore relationships between entities through graph traversal.
- Match specific keywords or phrases using full-text search.
This approach is ideal for applications like fraud detection, law enforcement, or personalized recommendation systems where structured and unstructured data complement each other.
How to Implement HybridGraphRAG in AQL
Let’s walk through an example where you:
- Use full-text search to find documents mentioning "cybercrime” and “threat”.
- Use vector search to retrieve documents similar to the query embedding.
- Use graph traversals to find relationships between the retrieved documents.
Combined Query Example:
LET query = [0.1, 0.3, 0.5, ...]
LET text_matches = (
FOR doc IN itemsView
SEARCH PHRASE(doc.text, [“cybercrime”, “threat”], “text_en”)
RETURN doc._id
)
FOR doc IN items
FILTER doc._id IN text_matches
LET score = APPROX_NEAR_COSINE(doc.vector_data, query)
SORT score DESC
LIMIT 5
LET related_nodes = (
FOR v, e, p IN 1..2 ANY doc GRAPH 'fraud_graph'
RETURN v
)
RETURN {doc, score, related_nodes}
Explanation:
- itemsView: An ArangoDB View representing the inverted index of doc.text.
- SEARCH PHRASE(...): Matches documents with the keyword “cybercrime”.
- APPROX_NEAR_COSINE: Compares each doc.vector_data with the query vector using Approximate Nearest Neighbor search via Cosine distance.
- LET related_nodes: Fetches the 1-to-2-hop neighborhood of the matching documents.
Conclusion
ArangoDB’s vector search, powered by FAISS, is more than a standalone feature—it’s a force multiplier for combining advanced data science techniques with graph-based insights. Whether you’re implementing natural language interfaces with LangChain or building hybrid query pipelines for real-world problems, the integration of vector search into ArangoDB’s multi-model system opens up endless possibilities.
Get started by creating your vector index, crafting AQL queries, and exploring what’s possible when you blend vectors with graphs. The tools are ready—now it’s up to you to build something amazing.
Some Perspectives on HybridRAG in an ArangoDB World
Estimated reading time: 7 minutes
Introduction
Graph databases continue to gain momentum, thanks to their knack for handling intricate relationships and context. Developers and tech leaders are seeing the potential of pairing them with the creative strength of large language models (LLMs). This combination is opening the door to more precise, context-aware answers to natural language prompts. That’s where RAG comes in—it pulls in useful information, whether from raw text (VectorRAG) or a structured knowledge graph (GraphRAG), and feeds it into the LLM. The result? Smarter, more relevant responses that are grounded in actual data.
(more…)