Performance analysis with pyArango: Part III Measuring possible capacity with usage Scenarios
So you measured and tuned your system like described in the Part I and Part II of these blog post series. Now you want to get some figures how many end users your system will be able to serve. Therefore you define “scenarios” which will be typical for what your users do.
One such a user scenario could i.e. be:
- log in
- do something
- log out
Since your users won’t nicely queue up and wait for other users to finish their business, the pace you need to test your defined system is “starting n scenarios every second”. Many scenarios simulating different users may be running in parallel. If your scenario would require 10 seconds to finish, and you’d start 1 per second, that means that your system needs to be capable to process 10 users in parallel. If it can’t handle that, you will see that more than 10 sessions are running in parallel, and the time required to handle such a scenario will lengthen. You will see the server resource usage go up and up, and finally have it burst in flames.
To find the bottlenecks in your scenario, you use statsd probes as we did in the last articles. Since we want to evaluate the possible bandwidth of our system, we will drive it into the red area, and finally make it burst in flames – to make it clear – we need to do this to see the possible limits.
How to create usage scenarios
You have to simulate clients in parallel. One solution would be to have one thread per client. However spawning threads isn’t that cheap and you will eventually overload your system doing the load injection. Since your client will be waiting for ArangoDB’s replies anyways, we can use an eventloop to handle test-runners “in parallel”: gevent.
Obey the rules of the eventloop!
We’re using pyArango which is using python requests as its backend. Since python requests is using blocking I/O (thus – waits for the server reply) we have to replace it by a non blocking version. We can use monkey patching to replace it under the hood:
import json as json_mod
import pyArango.connection
from gevent import monkey
from gevent import GreenletExit
monkey.patch_all()
import gevent
import grequests


class JWTAuth(requests.auth.AuthBase):
    def __init__(self, token):
        self.token = token

    def __call__(self, r):
        # Implement JWT authentication
        r.headers['Authorization'] = 'Bearer %s' % self.token
        return r
def get_auth_token():
    global auth_token, connection_urls

    if auth_token:
        return auth_token

    kwargs = {'data': '{"username":"%s","password":"%s"}' % ("root", "test")}
    for connection_url in connection_urls:
        response = requests.post('%s/_open/auth' % connection_url, **kwargs)
        if response.ok:
            json_data = response.content
            if json_data:
                data_dict = json_mod.loads(json_data)
                auth_token = data_dict.get('jwt')
                break
    return auth_token

class AikidoSession(object):
    def __init__(self, session_username, session_password):
        statsdc.incr('conn')
        if session_username:
            self.auth = JWTAuth(session_password)
        else:
            self.auth = None

    def post(self, url, data=None, json=None, **kwargs):
        if data is not None:
            kwargs['data'] = data
        if json is not None:
            kwargs['json'] = json

        kwargs['auth'] = self.auth
        return grequests.map([grequests.post(url, **kwargs)])[0]

    def get(self, url, **kwargs):
        kwargs['auth'] = self.auth
        result = grequests.map([grequests.get(url, **kwargs)])[0]
        return result

    def put(self, url, data=None, **kwargs):
        if data is not None:
            kwargs['data'] = data
        kwargs['auth'] = self.auth
        return grequests.map([grequests.put(url, **kwargs)])[0]

    def head(self, url, **kwargs):
        kwargs['auth'] = self.auth
        return grequests.map([grequests.put(url, **kwargs)])[0]

    def options(self, url, **kwargs):
        kwargs['auth'] = self.auth
        return grequests.map([grequests.options(url, **kwargs)])[0]

    def patch(self, url, data=None, **kwargs):
        if data is not None:
            kwargs['data'] = data
        kwargs['auth'] = self.auth
        return grequests.map([grequests.patch(url, **kwargs)])[0]

    def delete(self, url, **kwargs):
        kwargs['auth'] = self.auth
        return grequests.map([grequests.delete(url, **kwargs)])[0]

    def disconnect(self):
        statsdc.decr('conn')
        pass

# Monkey patch the connection object:
pyArango.connection.AikidoSession = AikidoSession
As you can see, we report dis/connects to a statsd gauge so we also can monitor that this isn’t happening to frequently (as it’s also performance relevant).
Handling workers
Gevent has the concepts of greenlets as one lightweight processing unit. We’re going to map one greenlet to one scenario.
The main process in python will spawn the greenlets (we call them workers for now). One greenlet will become the lifecycle of one such simulated user session.
There are two ways to terminate greenlets, one is the main processes – collecting them. This will then wait for freeing the resources of the greenlets until the process exits. Thus we could only do that after our test scenario. Therefore these greenlets would linger around using memory waiting for the final end of the testrun. Since we’re also intending to run endurance tests, that would pile up till our main memory is used up – not that smart. Thus we take the other way, we do raise GreenletExit to tell gevent it should clean them up:
def worker(account_id):
    print('hi!')
    raise GreenletExit

i = 0
while true:
    i += 1
    gevent.spawn(lambda x=i: worker(x))
    gevent.sleep(1.0 / float(req_per_sec))
Scaling the loadtest
Our python load simulation process has to:
- simulate our application flow
- generate json post documents
- generate http requests
- parse the http replies
- parse the json replies
- check the replies for errors
Thus we also need a certain amount of CPU. Since we’ve chosen to go the single thread with the greenlets, we’re limited to the maximum bandwidth one python process can handle. Since we want to have a stable pattern emitted by the simulator, we have to watch top for our python process and its CPU usage. While on a multi-core system more than 100% CPU may be possible for multithreaded processes, that’s not true for our python process. To have a stable pattern we shouldn’t use more than 80% CPU.
If we want to generate more load, we need more python processes running and thus be able to i.e. split the userbase we run the test on amongst those processes.
How to best evaluate the possible bandwidth?
Now that we have the fair knowledge of everything working – how do we evaluate the possible bandwidth of a given system?
While ArangoDB may survive a short ‘burst’, that’s not actually what we want to have. We’re interested in finding out what load it can sustain over a longer timeframe, including the work of database internal background tasks etc. We define a ramp time which the system should keep up with a certain load pattern. i.e. 4 minutes could be a good ramp time for a first evaluation. Once it survived the ramp time, we push harder by increasing the load pattern. That way we should be able to quickly narrow in on the possible bandwidth.
Once we have a rough expectation what the system should survive, we can run longer tests only with that pattern for 10 minutes, or even hours. Depending on the complexity of your scenario, the best way to create that ramp is to spawn more python processes – either on one or more load injector machines. You should also emit that process count to your monitoring system, so you can see your ramping steps alongside the other monitoring metrics.
How to recognize if the SUT is maxed out?
There are several indicators your ArangoDB aka “system under test” (SUT) is maxed out:
- Number of file descriptors – (that’s why we added the ability to monitor it to collectd beforehand) Each connection of a client to the database equals a file descriptor, plus the databases virtual memory and open logfiles, if it’s a cluster connection within the nodes, etc. this should be a rather constant number. Once you see this number rising, the number of parallel working clients is increasing, because of single clients not being ready on time due to database requests taking longer
- Error rate on the client – You should definitely catch errors in your client flow, and once they occur tell statsd they’re happening and write some log output. However, you need to make sure they’re not because of i.e. ID re-use and thus overlapping queries which wouldn’t happen usually
- CPU Load – Once all CPUs are maxed out to a certain amount, more load won’t be possible. Once that happens you’re CPU-Bound
- I/O Amount – Once the disk can’t read/write more data at once, you’re I/O bound
- Memory – this one is the hardest to detect, since the system can do a lot with memory, like using it for disk cache, simulating available memory from swap, and so on. So, being memory bound usually only indicates by disk and CPU being well below red levels
- Memory Maps – These are used to back bigger chunks of memory on disk or to load dynamic libraries into processes. The linux kernel gives an overview of it in
/proc//maps. We will be able to monitor these with collectd 5.8 - Available V8 contexts – while it is possible to execute a wide range of AQL queries without using Javascript / V8, Transactions, User Defined Functions or Foxx Microservices require them; and thus they may become a sparse resource
Getting an example running
Initializing the data
To get a rough overview of the ArangoDB capability we create a tiny graph that we may use later on in document queries, or traversals:
#!/usr/bin/python
from pyArango.connection import *
from pyArango.collection import *

conn = Connection(username="root", password="test")

db = conn["_system"]

if not db.hasCollection('user'):
    userCol = db.createCollection('Collection', name='user')
else:
    userCol = db.collections['user']
    userCol.truncate()

if not db.hasCollection('groups'):
    groupsCol = db.createCollection('Collection', name='groups')
else:
    groupsCol = db.collections['groups']
    groupsCol.truncate()

if not db.hasCollection('userToGroups'):
    userToGroupsCol = db.createCollection(className='Edges', name='userToGroups' )
else:
    userToGroupsCol = db.collections['userToGroups']
    userToGroupsCol.truncate()


noUsers = 100000
i = 0;
while i < noUsers:
    i+=1
    userCol.createDocument({
        '_key': ('user_%d' % i),
        'foo': 'bar',
        'count': i,
        'counter': i,
        'visits': 0,
        'name': ("i'm user no %d" % (i)),
        'somePayLoad' : "lorem Ipsem " * 10
    }).save()

userCol.ensureHashIndex(['count'], sparse=False)

noGroups = noUsers / 10

# we have one group each 10 users
i = 0;
while i < noGroups:
    i+=1
    groupsCol.createDocument({
        '_key': ('group_%d' % i),
        'counter': i,
        'name': ("i'm group no %d" % (i))
    }).save()


i = 0;
while i < noUsers:
    j = 0;
    i+=1
    while j < i % 10:
        j += 1
        userToGroupsCol.createDocument({
            '_from': ('users/user_%d' % i),
            '_to' : ('group/group_%d' % j),
            'groupRelationNo' : j,
            'foo': 'bar',
            'name': ("i'm making user %d a member of group no %d" %(i, j))
        }).save()
The actual test code
We create an example doing a transaction with a graph query updating some of the level 1 depth vertices we find. We run some other queries to directly modify the primary vertex. We think of this use case being a login procedure that counts logins on the user, and the groups he is assigned to be in. We control a range of users and the load pattern we want to inject by command line parameters:
#!/usr/bin/python
import json as json_mod
import sys
import random
import statsd
import pyArango
from datetime import datetime
from pyArango.connection import *
from pyArango.collection import *

# import requests
from gevent import monkey
from gevent import GreenletExit
monkey.patch_all()
import gevent
import grequests

statsdc = {}
auth_token = None
connection_urls = [
    "http://127.0.0.1:8529"
]

class JWTAuth(requests.auth.AuthBase):
    def __init__(self, token):
        self.token = token

    def __call__(self, r):
        # Implement JWT authentication
        r.headers['Authorization'] = 'Bearer %s' % self.token
        return r
def get_auth_token():
    global auth_token, connection_urls

    if auth_token:
        return auth_token

    kwargs = {'data': '{"username":"%s","password":"%s"}' % ("root", "test")}
    for connection_url in connection_urls:
        response = requests.post('%s/_open/auth' % connection_url, **kwargs)
        if response.ok:
            json_data = response.content
            if json_data:
                data_dict = json_mod.loads(json_data)
                auth_token = data_dict.get('jwt')
                break
    return auth_token

class AikidoSession(object):
    def __init__(self, session_username, session_password):
        statsdc.incr('conn')
        if session_username:
            self.auth = JWTAuth(session_password)
        else:
            self.auth = None

    def post(self, url, data=None, json=None, **kwargs):
        if data is not None:
            kwargs['data'] = data
        if json is not None:
            kwargs['json'] = json

        kwargs['auth'] = self.auth
        return grequests.map([grequests.post(url, **kwargs)])[0]

    def get(self, url, **kwargs):
        kwargs['auth'] = self.auth
        result = grequests.map([grequests.get(url, **kwargs)])[0]
        return result

    def put(self, url, data=None, **kwargs):
        if data is not None:
            kwargs['data'] = data
        kwargs['auth'] = self.auth
        return grequests.map([grequests.put(url, **kwargs)])[0]

    def head(self, url, **kwargs):
        kwargs['auth'] = self.auth
        return grequests.map([grequests.put(url, **kwargs)])[0]

    def options(self, url, **kwargs):
        kwargs['auth'] = self.auth
        return grequests.map([grequests.options(url, **kwargs)])[0]

    def patch(self, url, data=None, **kwargs):
        if data is not None:
            kwargs['data'] = data
        kwargs['auth'] = self.auth
        return grequests.map([grequests.patch(url, **kwargs)])[0]

    def delete(self, url, **kwargs):
        kwargs['auth'] = self.auth
        return grequests.map([grequests.delete(url, **kwargs)])[0]

    def disconnect(self):
        statsdc.decr('conn')
        pass

# Monkey patch the connection object:
pyArango.connection.AikidoSession = AikidoSession

def microsecs_to_millisec_string(microsecs):
    return str('%d.%dms' % (microsecs / 1000, microsecs % 1000))

def get_time_since(start_time, idstr):
    diff = datetime.now() - start_time
    microsecs = (diff.total_seconds() * 1000 * 1000) + diff.microseconds
    statsdc.timing(idstr, int(microsecs))
    return microsecs_to_millisec_string(microsecs)

statsdc = statsd.StatsClient('127.0.0.1', '8125')
conn = Connection(username="root", password=get_auth_token(), statsdClient = statsdc)
db = conn["_system"]

transaction = '''
    function(params) {
      var db = require('@arangodb').db;
      var startOne = Date.now();
      var q1 = db._query(
        `FOR oneUser IN user
            FILTER user._key == @userid
            UPDATE {
              _key: oneUser._key,
              lastseen: @timestamp,
              counter: oneUser.counter + 1
            } IN user`,
         {
          userid: 'user_' + params.i,
          timestamp: params.timestamp
        });
      var startTwo = Date.now();
      var q2 = db._query(`FOR v, e IN 1..1 OUTBOUND @user userToGroups
                            FILTER e.counter == @i
                          UPDATE {
                             _key: v._key,
                             counter: v.counter + 1
                          } IN groups`,
                         {
                           user: 'user/user_' + params.i,
                           i: params.i % 10
                         });
      var startThree = Date.now();
      var q3 = db._query(`RETURN 1`);
      var end = Date.now();
      return {
        tq1: startTwo - startOne,
        tq2: startThree - startTwo,
        tq3: end - startThree,
        all: end - startOne
      };
    }
'''

def worker(i):
    # add a bit of a variance to the startup
    gevent.sleep(0.1 * random.random())

    statsdc.incr('clients')
    start_time = datetime.now()
    try:
        aql = '''
        FOR user IN user FILTER user._key == @username RETURN user
        '''
        db.AQLQuery(aql, rawResults=True, batchSize=1, count=True, bindVars= {'username' : 'user_%d' % i})

        times = db.transaction(action = transaction,
                               collections = {"read": ['userToGroups'], "write": ['user', 'groups']},
                               params = {'i': i, 'timestamp': start_time.isoformat()})['result']
        for which in times:
            statsdc.timing(which, times[which])
    except Exception as e:
        statsdc.incr('errors')
        print('Error in worker %d: error: %s in %s' % (i, str(e), get_time_since(start_time, 'errw')))
    statsdc.decr('clients')
    raise GreenletExit

print(sys.argv)
userrange_start = int(sys.argv[1])
userrange_end = int(sys.argv[2])
req_per_sec = float(sys.argv[3])
while (userrange_start < userrange_end):
    userrange_start+=1
    gevent.spawn(lambda i=userrange_start: worker(i))
    gevent.sleep(1.0 / float(req_per_sec))
The additional dependencies of the above code can be installed like this on a debian system:
apt-get install python-gevent
pip install grequests
Analysing test results
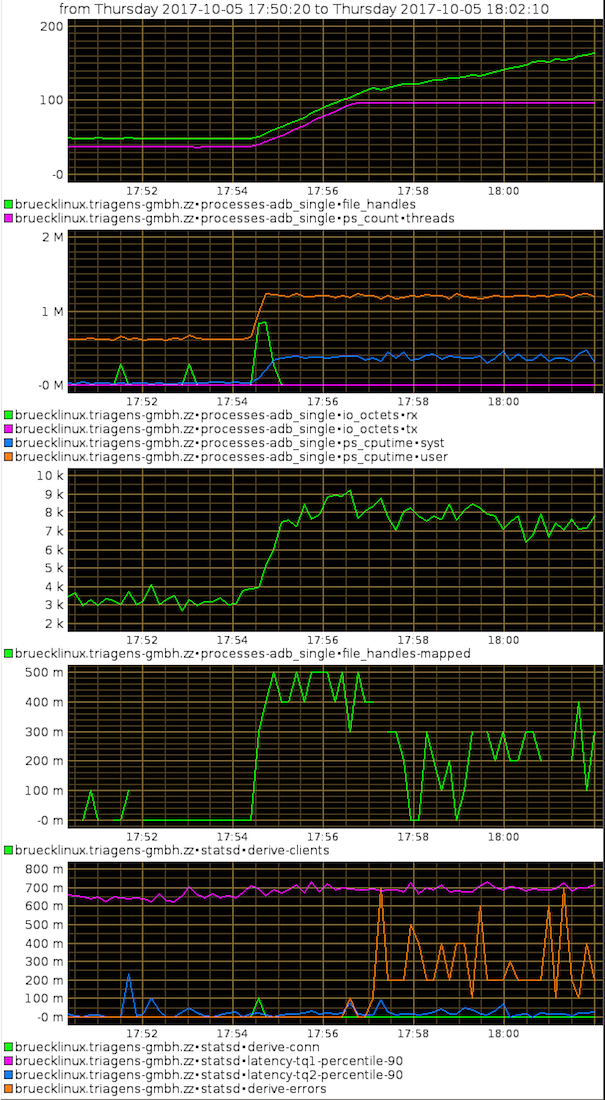
We start a first load injector on 17:51 : ./test.py 100 2000 1 and a second one increasing the load on 17:55: ./test.py 2000 4000 1
This is what we see in kcollectd from the testrun (Graph 1 at the bottom):

We’re analyzing these graph starting at the lowest, and going up graph by graph. Since KCollectd can only group gauges on one axis and can’t do any value translation, the graphs are grouped by the value ranges so that we can see meaningful variances. In Graphite we may add a second Y-Axis, add scales etc. to better group values by their meaning instead of their value.
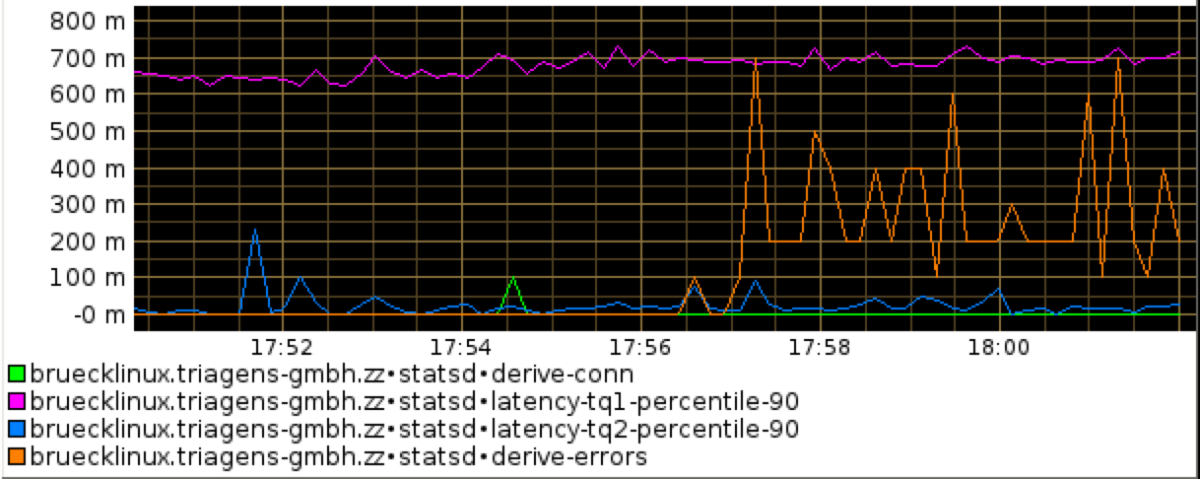
Graph 1

As mentioned above we’re also monitoring error counts via a statsd counter gauge, so we can actually see when the desired test pattern can’t be achieved either due to i.e. account overlapping or server side errors.
In the current test run we see that this error count starts to rise at 17:57 – thus the server fails to stand the load pattern. In the error output of the test we see the actual cause:
->could not acquire v8 context. Errors: {'code': 500, 'errorNum': 4, 'errorMessage': 'could not acquire v8 context', 'error': True} in 81295.936ms
Error in worker 3837: error: Error in:
    function(params) {
      var db = require('@arangodb').db;
      var startOne = Date.now();
      ...
So the resource we run out of is the V8 contexts to execute our transaction. The percentile of the queries however states that the execution time is constant.
Graph 2

Inspecting the next graph, we see that the number of concurrently active scenarios rises sharply as we launch the second test agent. Once the errors rise, these active clients will drop again, since the failing sessions finish quicker.
Graph 3

In the 3rd graph we see the number of memory mapped files double from below 4k to above 8k – which would be around the expected figures when doubling the test scenario.
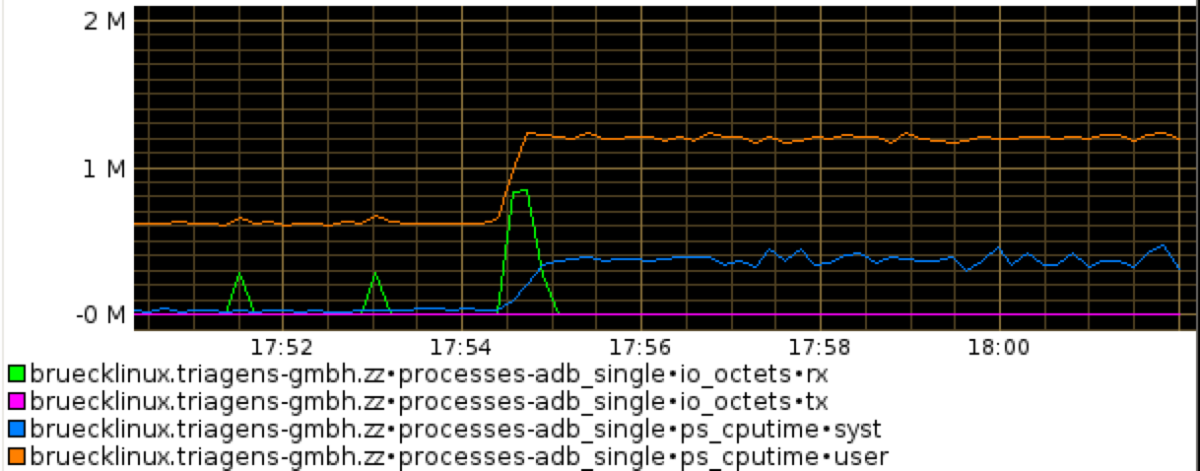
Graph 4

In the 4th graph we see that the user space CPU usage doubles, while the system CPU usage rises sharp. Part of working with more threads is doing locking of resources shared between threads. Thus the kernel space CPU usage rises with the server going into overload.
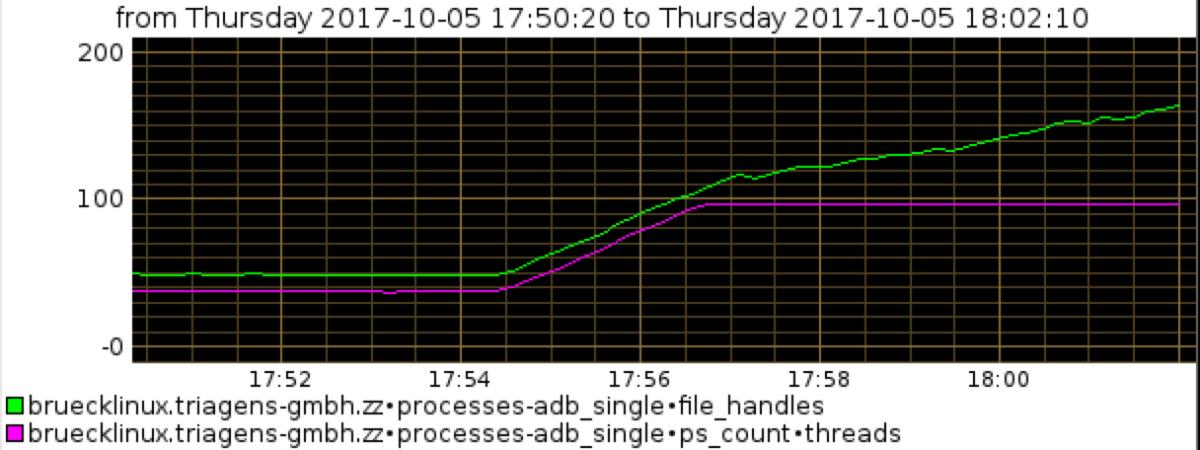
Graph 5

The 5th graph shows the thread count and the number of open file descriptors and server threads. As we raise the load we see them both climbing. Thus, the effect we see is, that the load test client opens more tcp connections (which are also file handles). The server spawns more threads to follow the load scenario – however the available throughput on this system isn’t bigger.
Thus more and more threads are launched waiting for CPU time to do their work. At some point, these threads start to run into the timeout to acquire V8 contexts for the transactions. While the client still opens more connections to satisfy the load pattern we wanted to create, the server can’t follow it anymore.
Conclusion
We successfully demonstrated a test client simulating client scenarios. Since we do much of our workload in a transaction and don’t transfer large replies to the client, the python/gevent combination can easily create the load pattern we desired. The SUT can sustain a throughput of 1 Scenarios/second. In subsequent ramping test runs one may try to evaluate in finer grained steps whether i.e. 1.5 Scenarios/second are possible. With such a result an endurance test run can be done over a longer time period.
Get the latest tutorials, blog posts and news:
 Skip to content