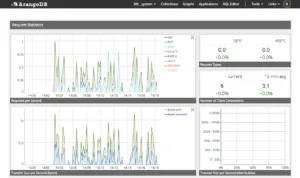
Monitoring ArangoDB and individual Foxx Apps with collectd
Great to know your database scales and database vendors like ArangoDB add some statistics on node / cluster health directly in their products.
But running a bunch of different servers and applications you need a central hub to collect monitoring data from all services running. In a series of recipes Willi shows how you could easily add monitoring capabilities to NoSQL databases like ArangoDB using collectd with the cURL JSON plugin.

ArangoDB provides several statistics in the administration interface (default: http://127.0.0.1:8529) that are accessible as JSON via API and could be easily accessed by collectd (recipe).
The same principle could be used to add monitoring to an individual Foxx app.
When you provide the result of a potentially heavy AQL query or expensive traversal via API you might want to log data like execution time, request parameters and a timestamp into a collection to enable monitoring. This could be triggered via before/after events in Foxx. Adding a route to grab the data could enable collectd (plus Nagios) to recognize which application slows down a database instance. Willi published the 3rd collectd recipe today to explain how to add monitoring to your Foxx app using collectd.
BTW: Did you recognize the new API-keys library? By adding limits to your Foxx routes you can prevent your services running slow due to misusage.
Other metrics that could be monitored via collectd are network I/O (recipe) and several more which are described in the collectd metrics recipe.
Get the latest tutorials, blog posts and news:

